Have you ever built an awesome Tableau dashboard only to have it take forever to load on Tableau Server? Or maybe mid-development, you’ve experienced the frustration of your views taking a long time to query in Tableau Desktop?
This guide will help you avoid long load and query times as much as possible by pointing out the things within your control when fine-tuning data for Tableau.
What is Data Fine-Tuning?
Data fine-tuning is a series of enhancements applied to a data source to optimize performance. To fine-tune your data, we need to examine the data elements in our control–namely data size, data complexity, and data shape–while ensuring we can answer the questions that the dashboard intends to solve.
Why is Fine-Tuning Data Important?
Fine-tuning your data can differentiate between a highly utilized dashboard and one that gets ignored. Dashboard consumers expect business intelligence tools to be highly responsive–loading in mere seconds and responding instantly to clicks and filters. While there is a lot you can do within the tool to increase the performance of your dashboards, this blog will highlight points across the entire data pipeline where you can optimize performance.
Tableau developers may have varied permissions when constructing Tableau data sources depending on the company’s data governance strategy. To perform the fine-tuning I will be talking about, you should have access to at least one of the following:
- An ETL/data prep tool such as Tableau Prep, Alteryx, or KNIME to create your data source for Tableau
- A data prep platform to create a table or view in a data warehouse that will connect to Tableau
- A data warehouse interface (such as Snowflake Web Interface) or SQL tool to create your own view or table that will connect to Tableau
Even if you don’t have access to the platforms listed above, it is still good to know these best practices when communicating your needs to the people who do create your Tableau data sources.
For this blog, most of the examples below assume access to some data prep platform. A common data pipeline may look like:
- Connect to Snowflake in Tableau Prep
- Clean and prep data
- Create a data source in Tableau Prep for Tableau Server
- Connect to data source from Tableau Server in Tableau Desktop
However, there are a myriad of different database and ETL platform combinations you could use in the data pipeline process. Where helpful in this blog, I will use Tableau Prep, Alteryx, KNIME, or sometimes just Tableau Desktop to show examples.
4 Actions to Fine-Tune Your Data for Tableau
Tip #1: Only Include the Columns and Rows You Need
This may seem obvious, but if you are creating a Tableau data source that will only be used for a single dashboard, you should limit the rows and columns to not go beyond the context of the dashboard. For rows, this is pretty straightforward–you should only include the records that will be used directly in the dashboard. This may mean only keeping two years of data even if you have five years or removing all other states except for the one you are analyzing. You can do this in Tableau Desktop itself with a data source filter.
Unless you’re really good at predicting how your Tableau development will go, knowing exactly which columns will be needed to build a dashboard is a much more complicated question. Ideally, only columns that are actually used in the dashboard (or used to create calculated fields in the dashboard) should be present in the published data source.
If you’re like me, you may start building a data set, grabbing a lot of extra fields ‘just in case you need it,’ only not to use them, and worse, fail to go back and remove these unused fields when you finish building your dashboard. To avoid this, I urge you to take a minimalist approach when first selecting the fields you think you will need for your dashboard.
You can easily hide any unused columns directly in Tableau Desktop or in Tableau Prep to boost dashboard performance (see gif above). However, if you are using an ETL tool other than Tableau Prep to feed data into Tableau, it would also improve the performance of the prep platform to eliminate unnecessary fields as early as possible. Whether you remove columns or rows, both of these actions are extremely easy in data preparation platforms. In Alteryx, you can use the Select and Filter tools to slim down your data. In KNIME, you can use the Row Filter and Column Filter nodes.
Tip #2: Adjust the Size and Type of Your Columns
It is essential to optimize the size of your fields as field size can have a significant impact on refresh time, query time, and Tableau Server storage. In most data prep platforms, you can adjust the size of your string columns and the precision of your numeric columns. For example, in Alteryx, you can use the Auto Field tool; in KNIME, you can use the Column Auto Cast node.
As for dates, if your dates contain both date and time information but you know you will not need timestamps, it is best to remove the timestamps before getting to Tableau.
It also helps to be thoughtful about any long string fields that you are passing into Tableau. Do you really need that field with paragraph-long entries? Even though Tableau has many built-in string functions, the data will be much more performant if you do as much string parsing or cleaning in a prep platform before getting into Tableau Desktop. String parsing functions within ETL tools are quite sophisticated. For example, check out the KNIME Textprocessing Extension or the Text Mining tools in Alteryx.
Tip #3: Use Aggregated Data when Appropriate
What is the lowest level of detail your end-users need to see? If they need the lowest level of granularity, then aggregating may not be an option. But if your user will only want to drill down to monthly data, for instance, then aggregation may make a huge difference–especially if you have many years worth of data.
The best way to aggregate data directly in Tableau is to create an aggregated data extract. But again, if using a prep platform, it may make sense to do the aggregation as early in your data pipeline as possible. Luckily, aggregating your data is also very easy in data prep platforms. Check out the Transform tool palette in Alteryx, the GroupBy node, and other transformation nodes in KNIME, or the Group and Aggregate functionality in Tableau Prep Builder.
Be cautious when using aggregated data though, as it may also lead to results you are not expecting. For instance, if your data is grouped at the week level, it will not be possible to roll up to the month or quarter level as a single week can fall on two months or quarters.
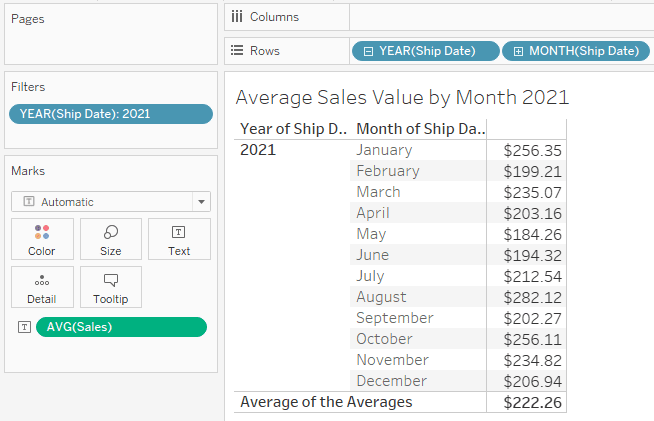
Averages in aggregated data sets can also be tricky. You may have a column that shows the average order value by month, but if you wanted to take the average for the year, you would essentially take an average of averages. This may be near the correct value but would most likely not yield the same results if you averaged the granular data for the whole year. We can see this through an example using Tableau’s Superstore data:

Tip #4: Turn Complex Tableau Calcs into Simple Data Prep Calcs
This one may not necessarily be something you can anticipate before building your dashboard, but there is no harm in going back and forth between Tableau and whichever platform you use to build the data source. In fact, it is good to ask yourself whenever working on advanced Tableau calculations, ‘is this something I can off-load onto my data prep process?’
The two advanced types of calculations in Tableau are Level of Detail Expressions (LODs) and Table Calculations. While they are both extremely useful types of calculations (and you definitely should learn how to use them), they are also more computationally expensive than your typical Tableau calculation.
The idea here is to minimize computation time across your whole data pipeline; it doesn’t help to remove a bottleneck in your dashboard if it creates a bottleneck in your ETL process. However, most of the time, we are substituting visualization load time, which needs to be extremely short, for data processing time upstream, which can be more forgiving.
Here are some examples where LODs or table calculations can be made easier in an ETL/prep platform.
Ranks
A common enough problem in Tableau is to rank your dimensions based on some measure and then filter to the top X. Doing this would require two uses of the RANK() function (or a similar table calc), as well as some sorting, and may quickly become more complex if you have any further interactive elements. Let’s say you have this example in Tableau:
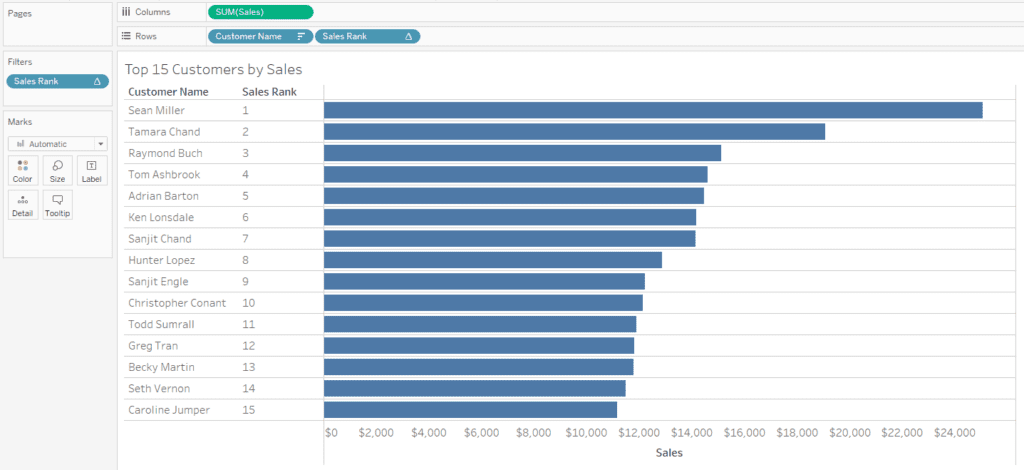
In Alteryx, you could create a rank column by grouping by customer, summing sales, sorting the sum of sales descending, then adding a Record ID tool to capture the rank. You could then join this aggregated data to the original data stream:

Note that creating ranks in this way creates a static rank for Tableau, whereas using the RANK() function in Tableau Desktop is dynamic. Because of this, I generally only use this method for sorting, where the order matters more than value, or in other instances where it is acceptable that the rank value is static.
Running Totals
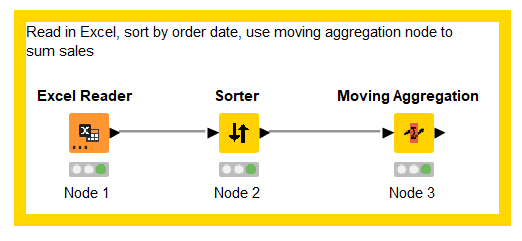
On a small scale, running totals may work just fine. Given enough data, you may notice long query times while developing or long load times for the visualization. Here is a simple example of a running total of Sales by Order Date in Tableau:

We can avoid the table calculation by utilizing the Moving Aggregation node in KNIME:
Cohorts
You may need to group your customers into cohorts based on the year of their first sale, for example. In Tableau, you may use a Level of Detail expression like this to create cohorts:

In Tableau Prep Builder, you could use an aggregate and join step combination to achieve the same result:

These examples are meant to be a starting point for how to rethink some of your complex Tableau calculations. I’m not saying you should always off-load more complex calculations into your data prep platform of choice, but be aware that it is definitely an option that can end up saving you time while helping with dashboard performance.
Closing
While doing any of the above alone will probably get you some minimal gains to your Tableau dashboard’s performance, combining many of these recommendations will hopefully be the thing that pushes your dashboard to that next level of responsiveness.
Want to learn more about Tableau or using data prep tools? Data Coach offers a wide range of Tableau courses for all levels of experience, along with Alteryx, Tableau Prep Builder, and KNIME courses. Take a look at the link below!


