
Ensuring appointments are completed on time by minimizing patient wait times is a key performance metric to providing an efficiently run healthcare center or facility.
This dashboard is designed to assist medical center/facility managers in understanding medical visit trends across centers and procedures.
This dashboard is built for healthcare system operation managers who need to monitor and be alerted to changes in wait times on a center and procedure level. Key questions these individuals need to answer:
The Cockpit view is filtered to a specific date level based on the selected value.
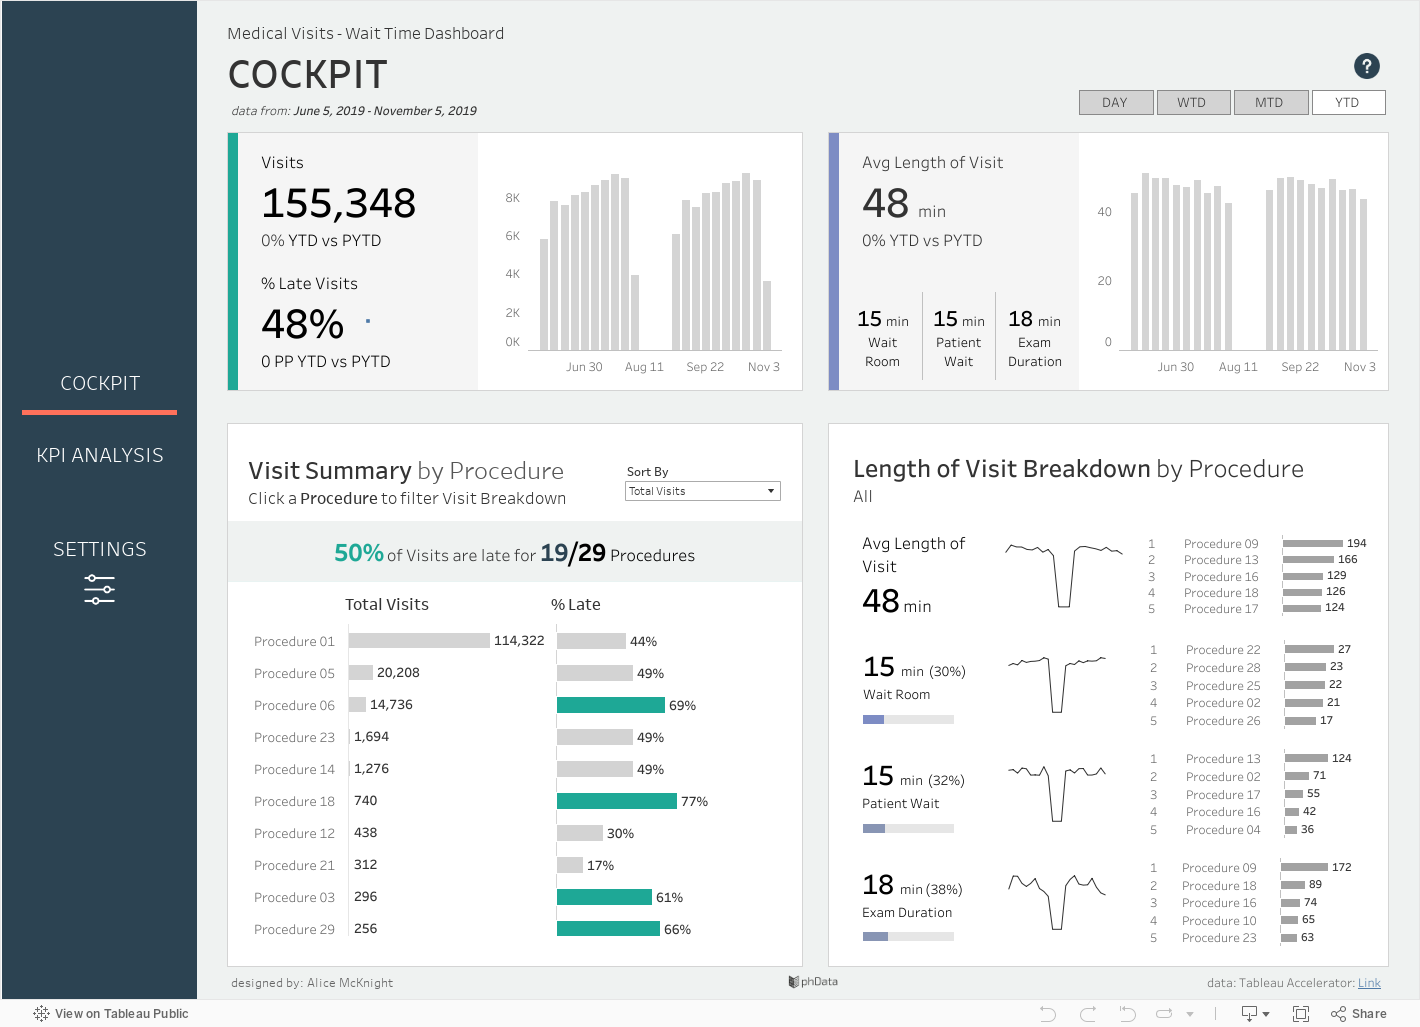
The three KPIs at the top of the dashboard (total visits, percentage of late visits, and the average length of visit provide a high-level summary of the overall performance across all centers. Bar charts showing the total number of visits by week and the average length of visits display the trend of these KPIs over time.
This portion of the Cockpit displays the total number of visits and the percentage of these late visits by procedure or center based on user selection in the Settings menu.
When the percentage of late visits is above the alert percentage selected under Settings, the percent late bar is colored bright green. These two bar charts can be sorted by the total number of visits or the percentage of late visits. The banner above the bar charts notifies the user of the number of centers or procedures above the alert percentage.
This card breakdowns the average length of visit into three components: wait time, patient wait, and exam duration. The average time, its proportion of the total visit, weekly average sparkline, and the top five centers or procedures for each element.
The Visit Summary filters this card and is filtered to that selection when a procedure or center is chosen.
This view is used to view the three KPIs (total visits, percentage of late visits, and average length of visit) across three date levels: hour, weekday, and month.
This chart can be viewed in several different ways. The combination of date levels in the heatmap can be selected using the Select Row and Select Column dropdowns located above the chart. The KPI cards to the left can be used to filter the KPI value in the heatmap.
Clicking on the Settings icon in the left side panel allows the user to update the heatmap in 3 ways:
Color by: Selection determines how color is used in the heatmap: Top 10, Min and Max Values, or KPI total
Select Center: Select a specific center to filter the chart
Select Procedure: Select a specific procedure to filter the chart
We hope you found this dashboard informative as you monitor KPIs for Medical Wait times. These views provide information about how the KPIs are performing across centers.
If you have any questions, need help, or are interested in having a team of Tableau experts design dashboards for you, feel free to reach out.