Tableau Prep and Alteryx Designer are key players on the data prep market. Tableau Prep is a more recent release that is now packaged with the Tableau Creator license. It is used for basic data prep and cleanse. Alteryx Designer is Alteryx’s flagship product that can be used for basic-to-advanced data prep and more advance data science including spatial, predictive, and prescriptive analytics.
Though there are some clear differences in both breadth and depth of product functionality, many look to the two products for their data prep needs. For that reason, for the next few weeks, let’s compare and contrast the products from the perspective of data prep alone.
In my eyes, the key capabilities of data prep are as follows:
- Input: connecting to your data
- Data Investigation: knowing your data, and what is wrong with it
- Data Cleansing: string manipulation, calculations, filtering, and handling nulls
- Data Joining & Transformation: manipulating the structure with joins, unions, or cross-tabs/transposing
- Output: where to data ends up
In this blog post, Part 1, we’ll be talking about Input and Data Investigation. Next week, I’ll discuss Data Cleansing. Then, we’ll get through Joiningand Outputand round it out with conclusions.
Some Quick Facts
Before we build side-by-side, let’s get some of the big questions out of the way.
Tableau Prep | Alteryx Designer | |
|---|---|---|
How much is a license? | $840/user per year* | $5,195/user per year* |
Supported OS? | Mac, PC | PC |
Can you schedule workflows? | Yes, with Tableau Server and the Prep Conductor add-on. | Yes, with Alteryx Server or Scheduler |
Can I publish the output to Tableau Server? | Yes | Yes |
Can I push my output to a reporting data mart (i.e., Snowflake)? | No | Yes |
*Market price from Alteryx and Tableau’s websites as of 3/6/2020. Always talk to your sales representative for details on your organization’s pricing.
Connecting to Data
The starting point with any data process is the same: getting connected to the data you need. For each of these, I will be connecting to an excel spreadsheet with CBS Survivor data that I scraped from various websites and stored in different sheets in Excel. I also want to take a look at how many sources they are capable of connecting to.
(This might be a good time to tell you that if you’ve never watched Survivor, there may be Survivor spoilers in the screenshots)
Tableau Prep
First of all, a few quick facts on Tableau Prep connections:
- 54 data source connectors, as of 2020.1
- ODBC and JDBC connectors for driver-based connections
- Connects to Tableau Server Published Data Sources
- Can do Custom SQL queries, like Tableau Desktop
- Capable of Initial SQL, like Tableau Desktop
Connecting to data in Tableau Prep Builder is very similar to how you would connect in Tableau Desktop. Either click the + by Connections or “Connect to Data” to open the connection screen.
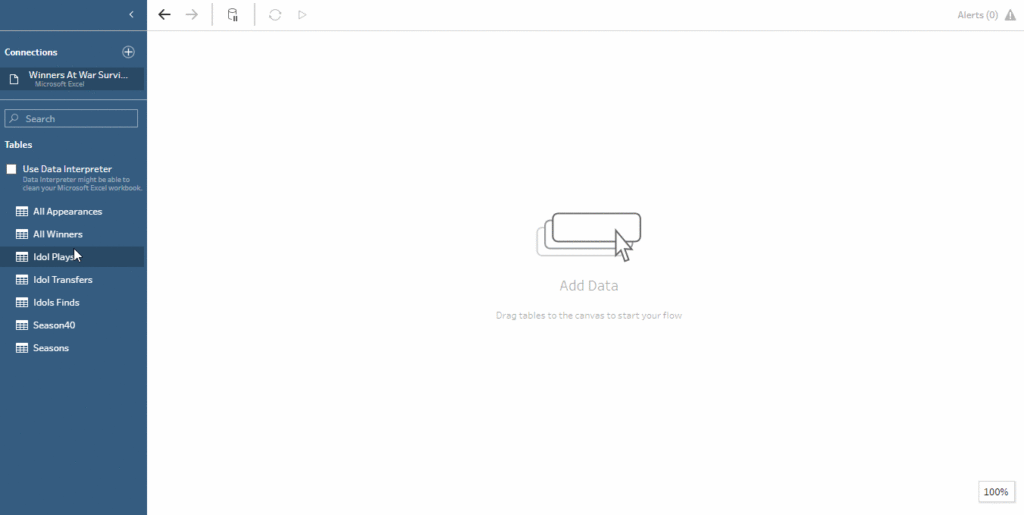
For excel, I am just going to navigate to the excel connector, select my file, and I will see all of the sheets lined up. For excel files, you can also drag the file straight from your file explorer on to the canvas to initiate the connection.
You will also see the option to use the Data Interpreter, which will allow Tableau to give its best shot and cleaning up and selecting the relevant data from especially messy excel sheets. When this is selected, additional clean sheets will show up for selection.
In this case, I just want to grab a preexisting sheet. To get this in my flow, I’ll select it and drag it onto the canvas.

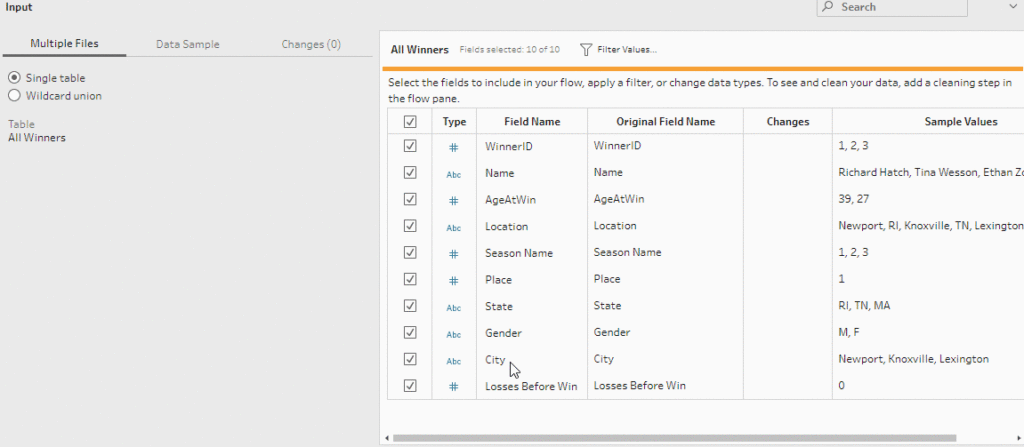
Once inputted, I get a preview of my data’s columns and some sample values. In the configuration window, I can decide which fields I want to select, filter, rename any columns, or sample data. Any change made will be documented in the Changes column and tab.

Alteryx Designer
Like with Prep, we’ll start with some facts about connecting with Alteryx Designer:
- 46 data source connectors, between the connection interface and Connectors toolkit
- 32 file connectors
- ODBC, OCI, and OleBC connectors for driver-based connections
- Can input connection strings rather than use connectors or DSNs
- Dynamically inputs from file directories
- Custom SQL queries
There’s several different ways to connect to data in Alteryx, but in this walkthrough I’ll focus specifically focus on the good, old fashioned, Input Tool.
To start inputting data, drag the Input Tool on the canvas and select the caret next to Connect to a File or Database.
Like with Tableau Prep, I could also instantiate this connection by dragging the excel file from the file explorer onto the canvas if we wanted to.
Once we have our connection established, we can configure the tool. For excel files, this includes a record limit, deciding how to handle the first row (field names or data), which sheet to use, etc. For database connections, this will also be where you can write your query.

If connecting to a database, you can also use a driver-based connection via connection string in the the space where the path to my file currently is written. I love this option because it transitions to Alteryx Server with very little administrative overhead.
Other Alteryx Input tools to be aware of:

Connect In-Database Tool
Alteryx also has the capability to connect to and manipulate data In-Database, keeping the data in the source system. This is a key benefit for both speed and security.

Directory Tool
Input the contents of a directory, either all file types or of a specific file type. I use this most often in conjunction with the Dynamic Input tool (below) to get the most recently modified file in a directory.

Dynamic Input Tool
Input multiple files or data streams at runtime based on an incoming data connection.

Map Input Tool
Used to draw or select a desired map object to use as an input in a workflow.

Text Input Tool
Write text directly into the Alteryx workflow. This is helpful for inputting mapping fields, ad hoc testing, and inputting URLs to be webscraped with the download tool.
Alteryx also has an entire toolkit of connectors for various sources such as MongoDB, Amazon S3, and Sharepoint Lists. It also has a Download tool which I use frequently for webscraping.
(I swear I’m almost done with options for input here) Any input tool can also be turned into a Macro Input tool. Macros are out of scope of this, but look out for an Alteryx Macro series from John Emery coming soon.
Data Investigation
We’ve got our data, but how do we know what we need to do with it? People who know their data well generally understand the varied inaccuracies associated with it, but there’s always things we can miss. Here I am looking for the tools and interfaces that each product has to offer that will let me learn more about my data.
In case I forgot to mention this before, this data is kind of a mess.
Tableau Prep
Tableau Prep has their data investigation capabilities built right into the interface. To get to the interface that has the most fruitful investigation material, I’m starting a new “Clean” step.

The Clean interface shows the values of each column binned and the distribution of each bin. It also shows recommendations on how to improve the data.
Alteryx Designer
Alteryx will require you to add other tools for data investigation. The most common investigation tool is the Browse tool. You can drag this onto your workflow or use the hotkey Ctrl + Shift + B. Run your workflow to populate the browse tool.
The Browse tool will show you a similar distribution of values as well as bars that display Null values (yellow) vs green (ok).
I also especially like the Field Summary tool from the Data Investigation toolkit. It connects to your data flow and has three outputs: O (output), R (report), I (interactive report).
The O output results in detailed information about each field. Depending on field type, this can include max, min, standard deviation, range of dates, etc. All field types show the percent missing/null and number of unique values. String values will also contain comments and remarks that can include recommendations for how to clean your data.
The R and I output anchors should be connected to Browse tools to view reports of the information from the O anchor.
Other Alteryx Data Investigation tools to be aware of:
Alteryx has an entire data investigation toolkit, many of which are included in the R Predictive Tool download. There are a lot here. To go through the entire toolkit, click here.

Conclusions Thus Far
We’re not done yet! Next time, we will be discussing Data Cleansingbased on some of the issues we find in the Data Investigation. But what are some highs and lows so far?
Tableau Prep
Pros:
- Tableau users will be very familiar with the data connection process
- Very simple interface for understanding your data
- Recommendations during investigation are generally pretty spot on
- Bundled in Creator License
Cons:
- Lacks breadth in data investigation functionality
- Prep Conductor costs can majorly inflate based on number of Server users
Alteryx Designer
Pros:
- Allows a wide variety of sources and methods for connecting
- Connection strings! Yay!
- Significant breadth in investigation functionality
Cons:
- Slightly less user friendly process to get to data investigation than prep
- Separate platform to deploy and license, if a Tableau shop
- Cost per license significantly higher
So far a key take away is that Tableau Prep has generally had the upper hand on ease of use, while Alteryx is clearly reigning over depth of functionality. We’ll see if that pattern continues in the next posts. Keep your eyes out for Part 2 coming soon!
Do you have more questions about Tableau or Alteryx? Talk to our expert consultants today and have all your questions answered!


