

In a recent project, we wanted to know: Is the average number of days between orders increasing or decreasing across the company?
The questions behind that question are:
- What is the number of days between orders per customer?
- What is the average number of days between orders per month?
I tried using table calculations but realized it became very complicated very quickly trying to compare the averages across the month. In an attempt to work smarter and not harder, I realized I could calculate the number of days between orders in Tableau Prep and then pull it into Tableau for analysis. However, Tableau Prep does not have a native LAG() function but using some of the recent formula updates to Tableau Prep, we can mimic the LAG functionality.
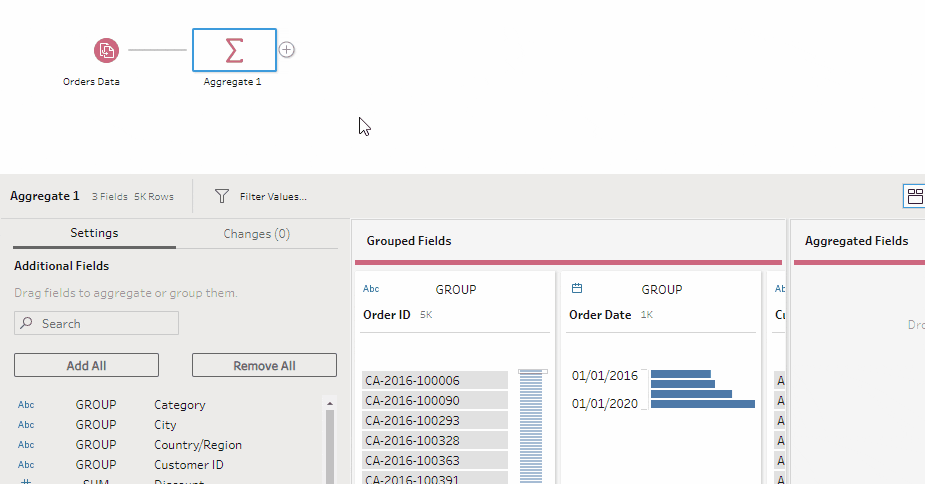
Step #1: Aggregate
The first step is to summarize each order into one row per customer and order date.
- Add an Aggregate step
- Add Customer Name, Order ID, and Order Date to the Grouped Fields
- The Superstore data has instances of multiple orders on the same day and we want to include those same-day purchases in the calculation.

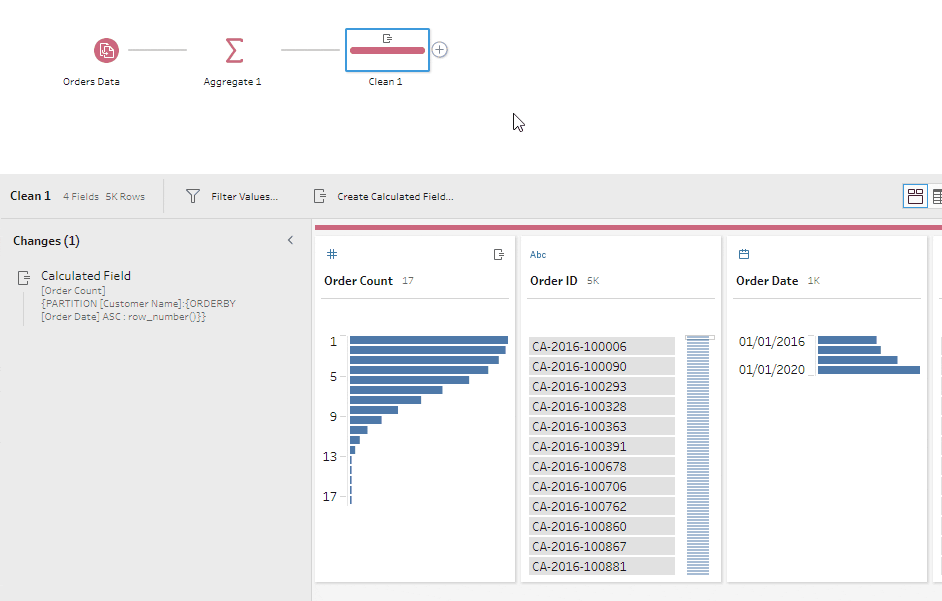
Step #2: Enumerate
Next, we need to create a field that enumerates the orders chronologically. For this, we use the row_number() calculation.
- Add a new Clean Step
- Create a calculated field called “Order Count”
- {PARTITION [Customer Name]:{ORDERBY [Order Date] ASC : row_number()}}
- PARTITION identifies what we want to group by; ie We want one result for each Customer Name.
- ORDERBY ASC will list all the orders in chronological order starting with the earliest order first and most recent order last.
- Row_number() provides an order count. The row number of 1 is the 1st order, etc.
- {PARTITION [Customer Name]:{ORDERBY [Order Date] ASC : row_number()}}
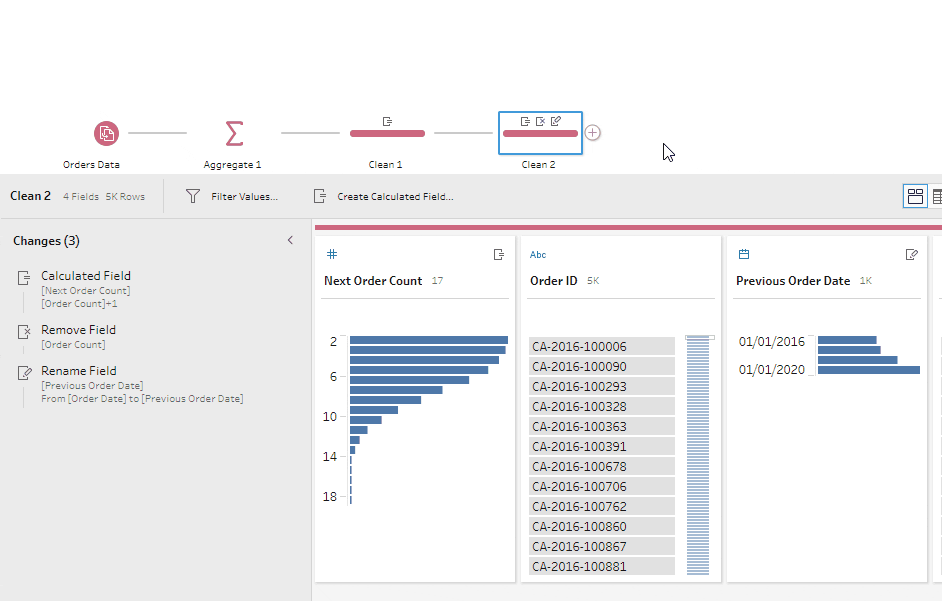
Step #3: Calculate
To calculate the time between different orders, the dates will need to be joined so an order and the previous order are on the same line. To accomplish this, we first need to create a field that can be used to align an order with the previous order.
- Add a new Clean Step
- Add a calculated field called “Next Order Count”
- [Order Count]+1
- Remove the Order Count Field
- Rename the Order Date field to “Previous Order Date”
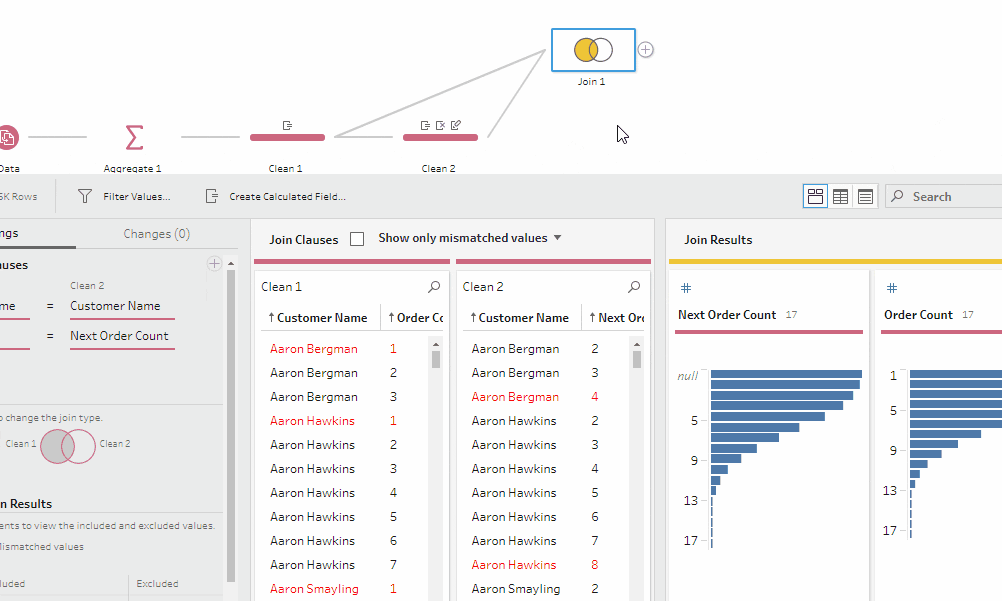
Step #4: Join
Next, we join the clean step with the original order enumeration with the adjusted enumeration.
- Add a join step
- Join on Customer Name = Customer Name and Order Count = Next Order Count
- Here we are matching the 1st order (row number 1) with the 2nd order (row number 1+1).
- Be sure to include all orders from the Order Count step so we can have their first order
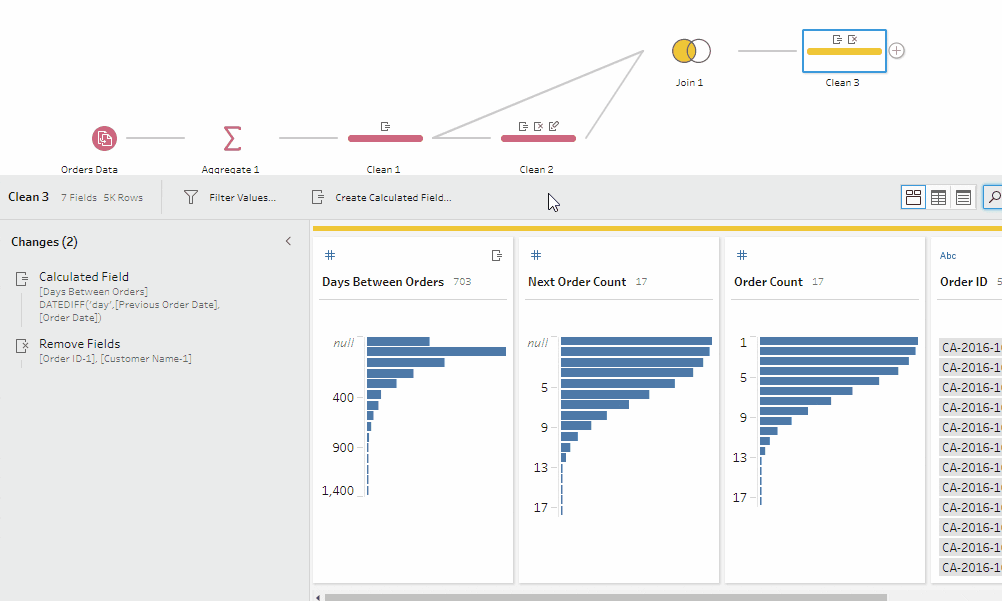
Step #5: Calculate
Now we can calculate the number of days between the current order and the previous order.
- Add a new Clean Step
- Create a calculated field called “Days Between Orders”
- DATEDIFF(‘day’,[Previous Order Date],[Order Date])
- Remove duplicate fields:
- Customer Name-1
- Order ID-1
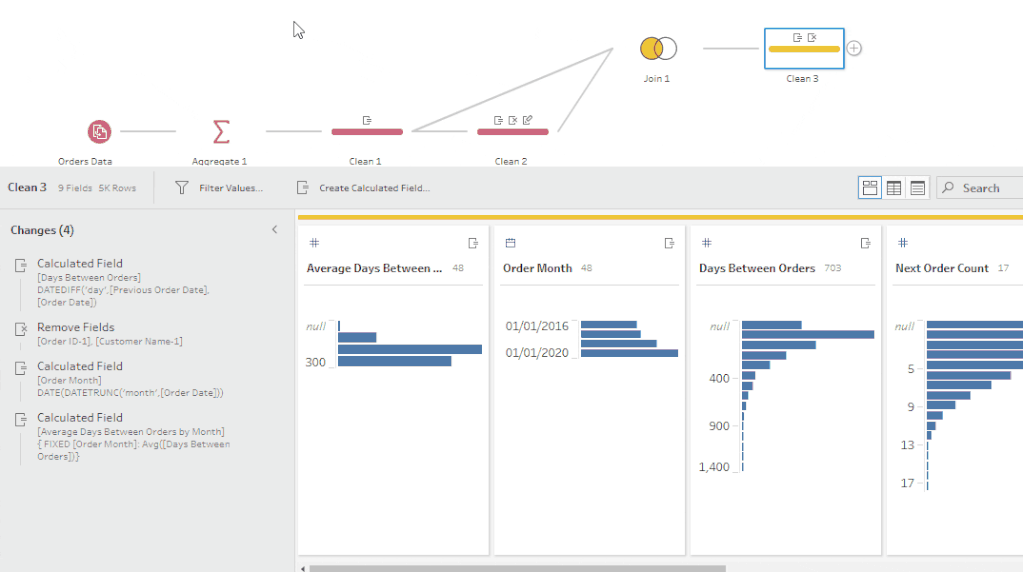
Step #6: Average
In order to see if the number of days between orders is increasing or decreasing, we need to group the average number of days between orders by month.
- Add a Calculated Field called “Order Month”
- DATE(DATETRUNC(‘month’,[Order Date]))
- Add another Calculated Field called “Average Days Between Orders by Month”
- { FIXED [Order Month]: Avg([Days Between Orders])}
- This works the same way as a fixed calculation in Tableau Desktop. It’s saying for each Order Month, “what is the average number of days between orders?”
Step #7: Join
Finally, we join the new calculated fields back to the original data set.
- Add a Join step joining the Avg Days by Month step to the original data.
- Join on Order ID
- Clean up the results by removing:
- Order Date-1
- Customer Name -1
- Order ID-1
Step #8: Analyze
Now, when we import the data to Tableau we can see the trend in Average days between orders has been decreasing over the past few months.

Want to try it for yourself? Here are the files I used: Click to Download Files


