

In this blog, we will cover what tables and pivot tables are, the advantages and limitations of each, and the factors to consider when choosing which element to use. At the end of this blog, you will have a firm understanding of both elements and how to utilize each in your day-to-day data exploration.
What are Tables in Sigma Computing?
A spreadsheet-style data element, tables display data points in cells organized by columns and rows. In Sigma, data is managed at the column level rather than on individual cells. This means actions such as aggregates and format changes apply to every cell in a column. Inputting a table in Sigma will automatically provide all possible columns and rows of your data.
The table below shows orders made in a given region/state/city – including the revenue, cost, and profit for each order. The Summary tab is utilized to show the overall totals for all regions (grouped by region) in the dataset.

How Column Totals are Shown
Column totals for a table can be shown in multiple formats. The user can choose to show totals by an aggregate (SUM, AVG, etc.), or, specific to Sigma, users can use the Summaries option to show a single value for the entire table.
Note that these summaries are aggregates of key measures. To add summaries to your tables, use the + button to the right of Summary. These are great for quick analysis and are recommended when working with tables to show KPIs.

Use Cases and Examples
Tables are best for data presentation, analysis and reporting, and data modeling.
- Presentation: Commonly used to present structured data in a spreadsheet-like format; each row represents a record, and each column represents a different attribute or measure associated with that record.
- Analysis: The user can effortlessly filter, sort, and group data based on chosen criteria using the element properties option on the left side of your visuals.
- Reporting: Mainly used to view and aggregate data in a common view that is easy to process. A table is a great way to display everything associated with the chosen criteria/data set.
- Data Modeling: Tables lay out your exact results. Using a table for your modeling can help avoid data inconsistencies and errors and ensure that the stored data in the table is easy to understand and use.
What are Pivot Tables in Sigma Computing?
A pivot table in Sigma represents a table of data that summarizes selected columns and rows of data. This can reorganize your data so that it shows emphasis on specific attributes. Inputting a pivot table in Sigma will start as blank – It is up to the user to select which items are added to the pivot rows, columns, and values.
How are Column Totals shown?
Column totals are shown automatically based on the individual column/value specified in the Values section of the elements pane (left side). A Total row is also provided for quick analysis.
In the example below, we are filtering the pivot table to show only the Midwest region. From here, we are drilling into the region, showing corresponding states and the cities within each state. Also included is conditional formatting on Sum of Profit to give an idea of how quickly a user can see which cities are performing well. (To add conditional formatting, use the Element Format tab on the left side, then select Conditional formatting).

This is the initial view of your new pivot table! By scrolling down, you will see the automatically populated column totals. See below.

Use Cases and Examples
Pivot tables are used for many of the same reasons as tables but provide an extra layer of data exploration. They give the user full flexibility on what data is shown in the table without having to add filters to your table. Pivot tables can be best used for summarizing your data, comparative analysis and aggregation, and user interaction.
- Summarization: The user can aggregate based on dimensions and measures, allowing quick calculations across multiple categories/groups within the data set.
- Analysis and Aggregation: Users can compare data across categories, measures, and periods in seconds. Individuals can create side-by-side comparisons for measures, dimensions, and periods, which can be used to identify trends and variations across your data.
- User Interaction: Pivot tables allow the user to interact more easily with data in a table. Using a pivot table creates a waterfall-like approach to a table view. With just a couple of clicks, you can see the many layers, enabling faster manipulation and analysis.
How do you Decide?
Tables
Tables are most appropriate for data visualization when exact measures are needed and for comparing values. Tables are easy to read, show the array of data clearly, and allow the end-user to analyze their data at a glance.
Sigma’s grouping ability allows users to put together tables with ease and make specifications based on user preferences. Tables are nice additions to other visual elements to give your audience deeper insight into your analysis by providing exact numbers directly from your raw data source.
Using tables instead of pivot tables in data modeling is advantageous because tables use simpler SQL queries to execute. Pivot tables, on the other hand, are useful for summarizing data but can lead to long load times and inefficiencies with larger data sets. By using tables for your modeling needs, you can pre-aggregate your data, making your queries more efficient for specific analysis and reporting needs.
Pivot Tables
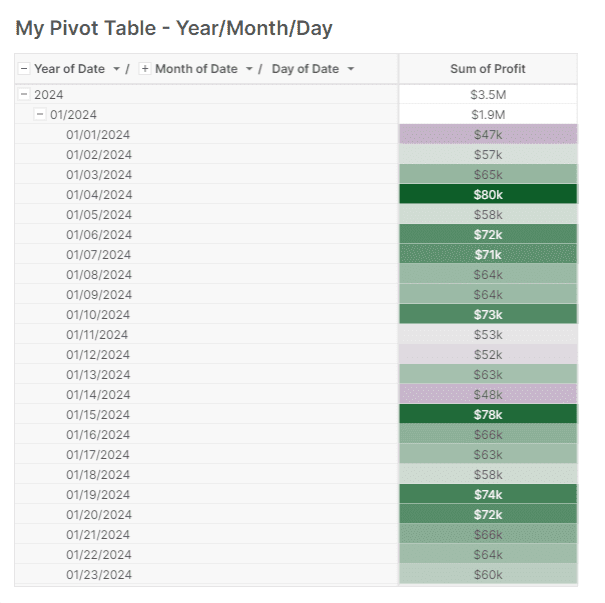
Pivot tables are optimal for summarizing a few key factors to aid in reaching conclusions. Imagine you are looking at total profit for a specified year. With the help of a pivot table, you can expand and collapse your hierarchy of data to its smallest granularity with just a few clicks.
In the example below, we are using the year/month/day hierarchy to show the sum of profit. The use of a pivot table here provides clear and accurate data pulled in directly from your data source.
Factors to Consider
When deciding on which table format best fits your use case, it is critical to consider the purpose of the table. Pivot tables offer great flexibility, while tables can be more efficient. Make your decision based on the specific requirements of your data model, and think about the specific goals and the preferences of your end-user.
For example, a table is great if the user prefers a more detailed view with granular data. If they prefer more of a summarized view, a pivot table could be more effective.
Other key considerations include aggregation of your data, flexibility and interactivity, visual clarity, and summarization.
Closing
In the early design stages of your dashboard, we recommended trying out both options; it’s important that the visual looks right to you before you make a final selection. Try out different total options and conditional formatting and provide variations of each for your audience.
In my experience, using pivot tables for my first or second iteration works best. I can summarize and highlight key points I want to get across in my visuals. Then, after sharing with my audience, I can determine which option works best for the final product.
In conclusion, the choice between using a table or pivot table element in Sigma depends on factors such as the complexity of your data, aggregation needs, flexibility, visual clarity, and, of course, the purpose of your visual.
At the end of the day, it’s all about telling the story of your data and using whichever element provides the most clarity.
If you have any additional questions regarding tables vs. pivot tables in Sigma, contact our team of experts.
FAQs
Yes, but remember to consider utilizing regular table elements for displaying raw data and pivot tables for summarizing and highlighting key areas of your data.
Maybe an Input Table is what you’re looking for? Try this amazing blog written by Katrina Menne. What are Input Tables in Sigma Computing
Check out this in-depth blog from Hayley Hadges, Aggregating Tables in Sigma Computing


