UPDATE: There’s been a lot of discussion on Twitter about the best method for automatically deselecting marks or “disabling” marks selection. After a half-dozen methods the Tableau community landed on the following:
Hi friends. There is a simple way to unselect the Marks, please take a look https://t.co/i4aDT0POUx no way to retain the highlighting, though 😉
— Yuri Fal (@yurifal) December 7, 2019
Yuri’s approach is simple and requires only five steps. There isn’t a blog post for it, but it is on the forums.
thank you @jonathandrummey, i didn’t mind a single tip is worth a dedicated post 😉 i’ve got something (else) in the making, covering the forum threads on “augmented” filters, here https://t.co/gFkF0mBCDR and here https://t.co/cxHMUIUCyT i’ve used a Header-as-Button tip there.
— Yuri Fal (@yurifal) December 7, 2019
Note that Yuri is the originator of this methodology and I just wanted to blog on it because I think it is very elegant and requires only simple calculations. Because I like simple solutions, I’m deleting my post and sharing this simple methodology.
Step 1: Create your visualizations.
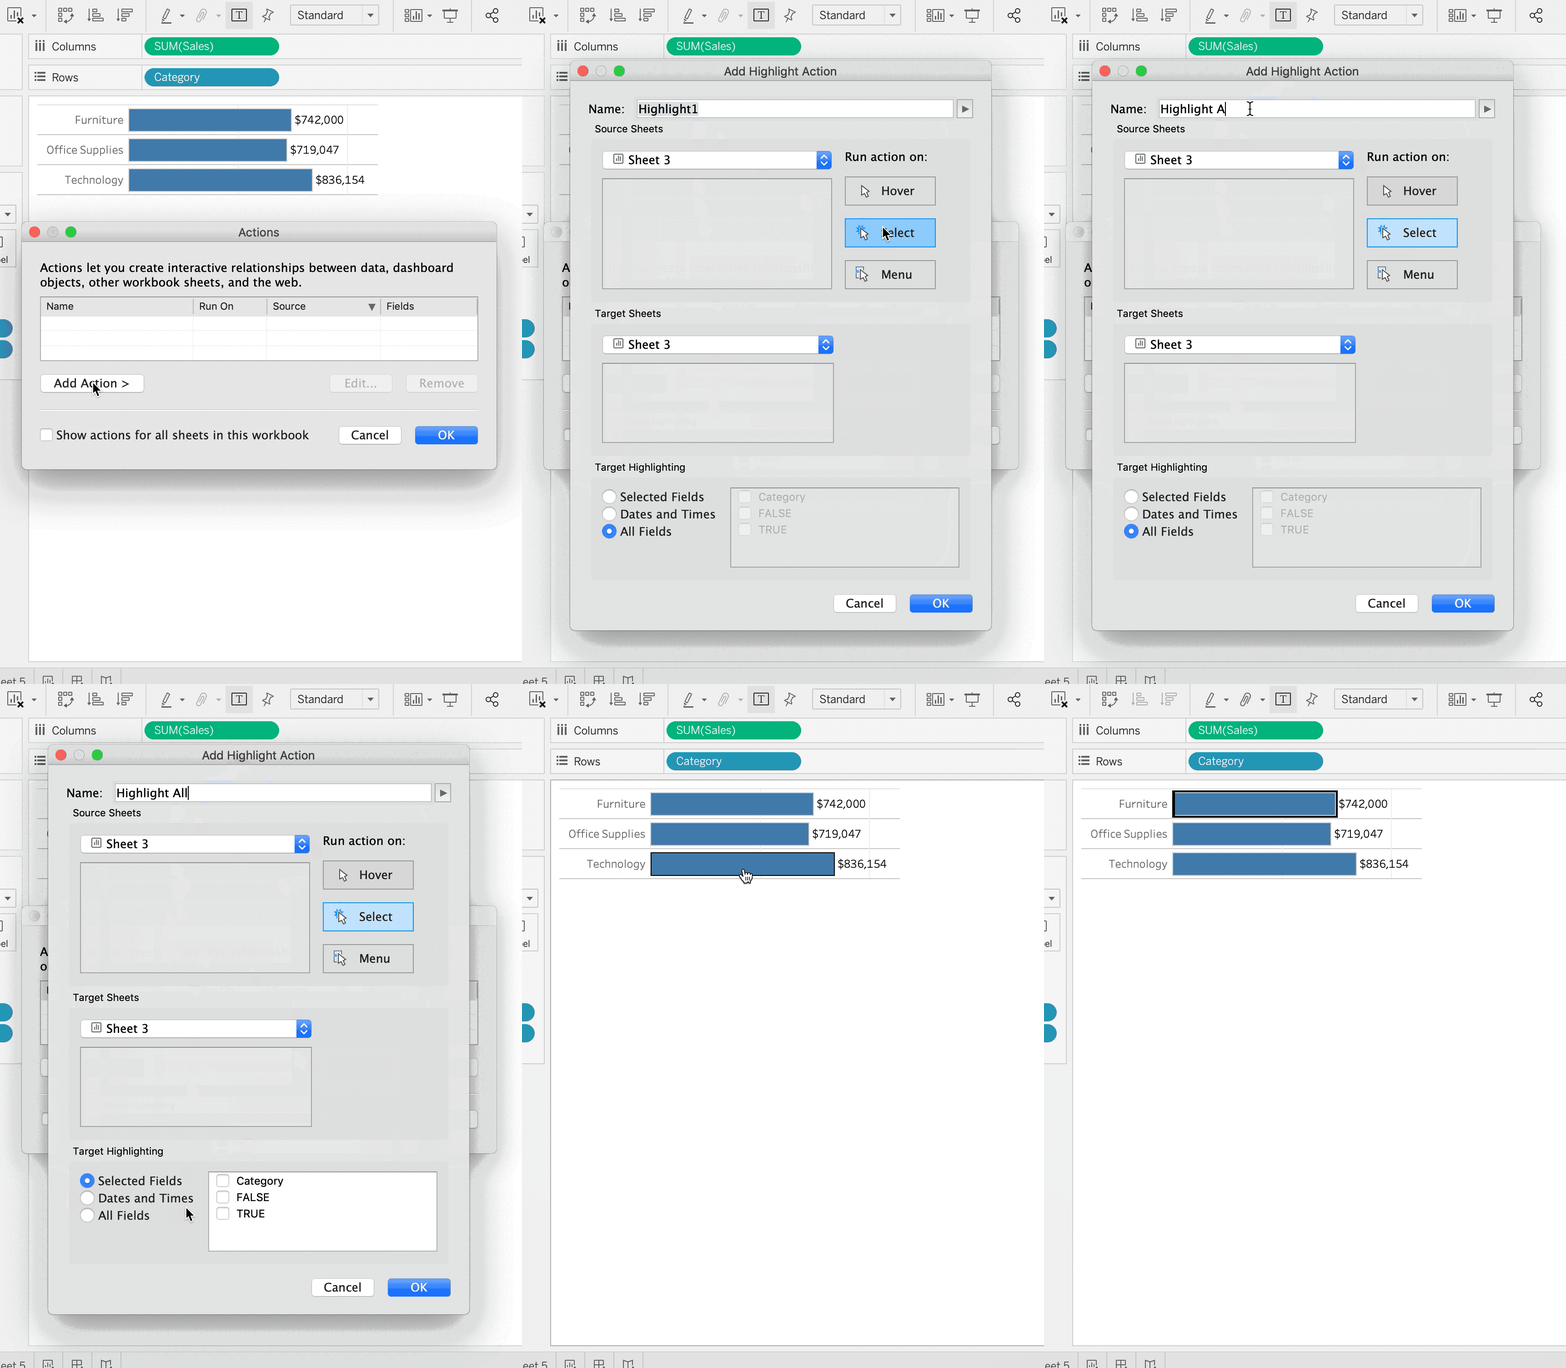
For our example its just a simple bar chart. Notice how you can still highlight values and it shows an outline around the box.
Step 2: Create two calculations one where the calculation is equal to TRUE and the other where the calculation is equal to FALSE.
					  // TRUE
    TRUE

					 // FALSE
    FALSE

Step 3: Add these calculations to the marks card.

Step 4: Create a highlight action that highlights the TRUE calculation on click.
You can use either TRUE or FALSE, both work.

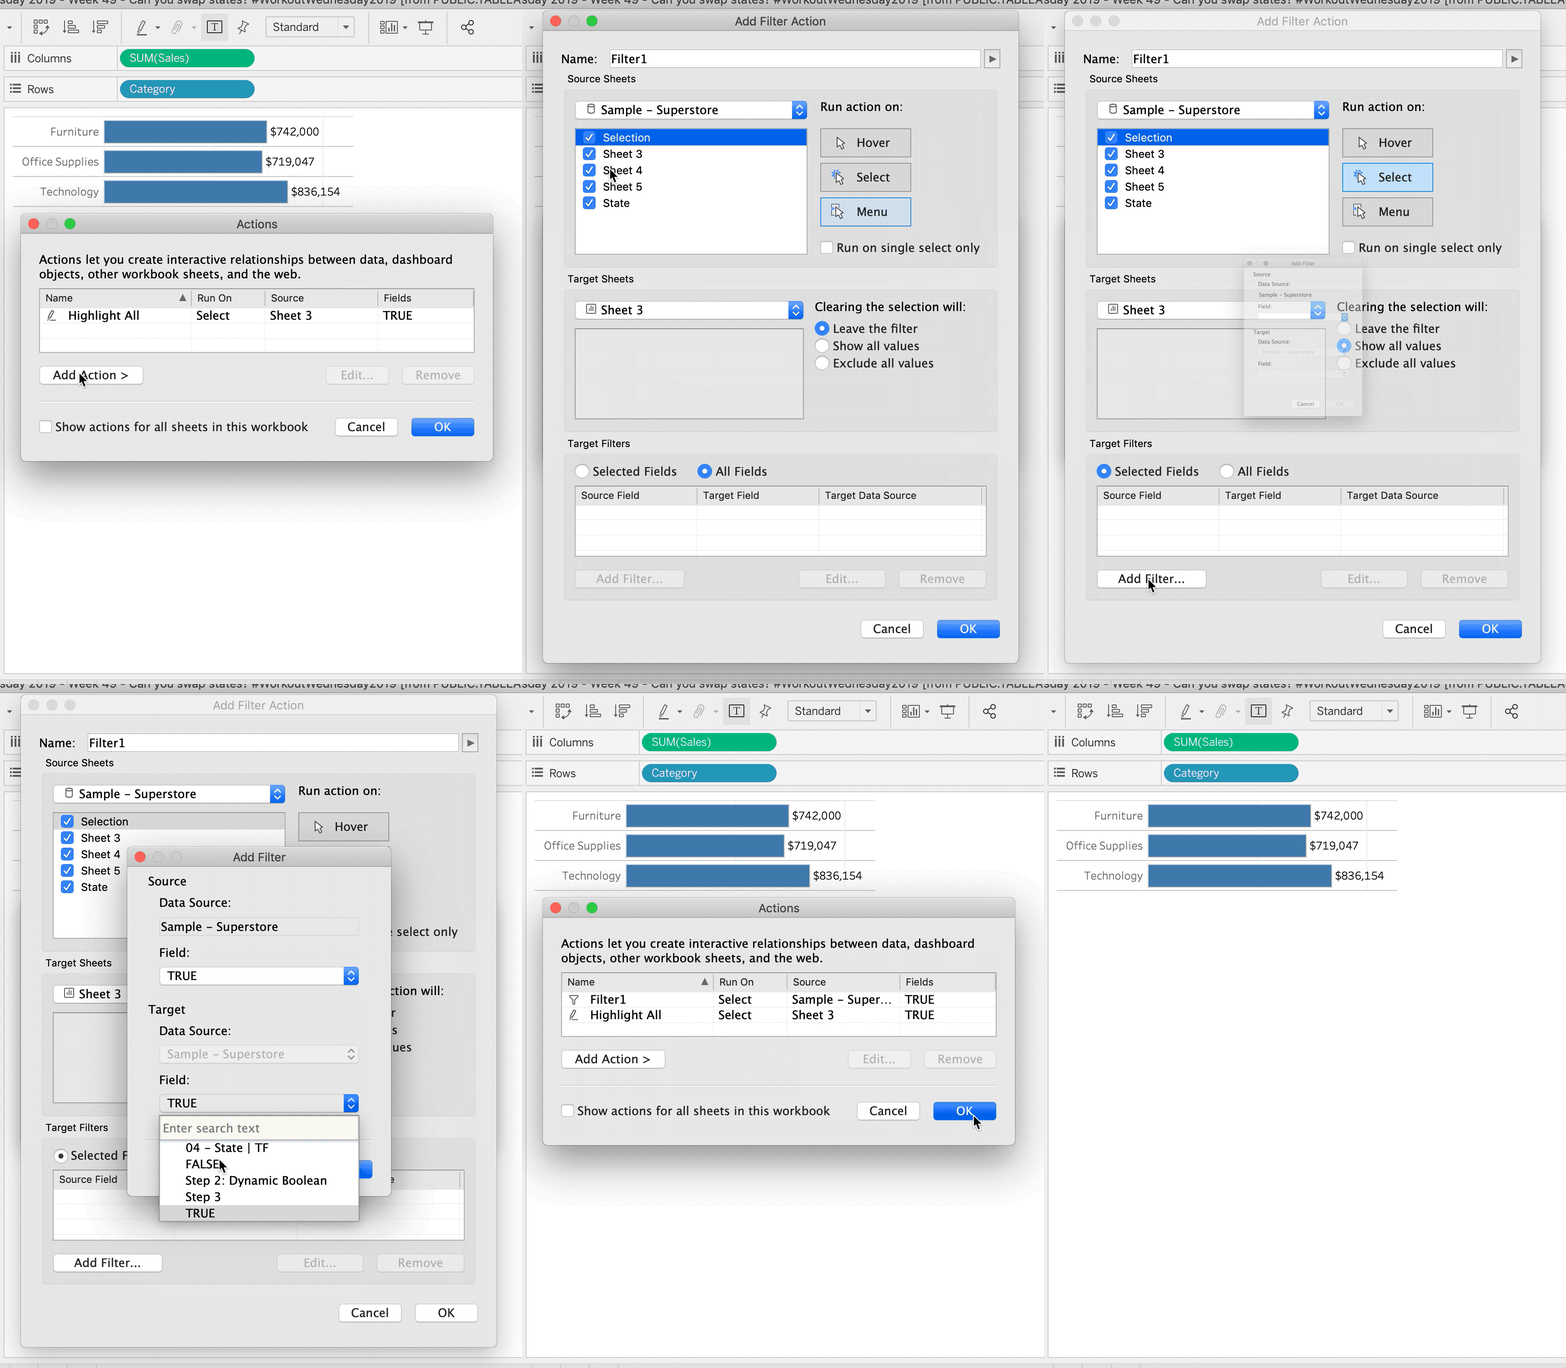
Step 5: Remove the selection border with a filter action where on select the selected sheet will filter the source field of TRUE to the target field of FALSE.
Trust me. Watch the GIF below and see it in action.

And thats’ it. No fancy calculations, no data blending or duplication.


