In this post, we’ll discuss how to create three simple and common uses cases for Sets in Tableau:
- Identifying the Top or Bottom Items in a list
- Combining the Top and Bottom Items in a list
- Adding an “Other” line item to the Top and Bottom lists
You can also view the report here in Tableau Public.
Create a Top OR Bottom Set
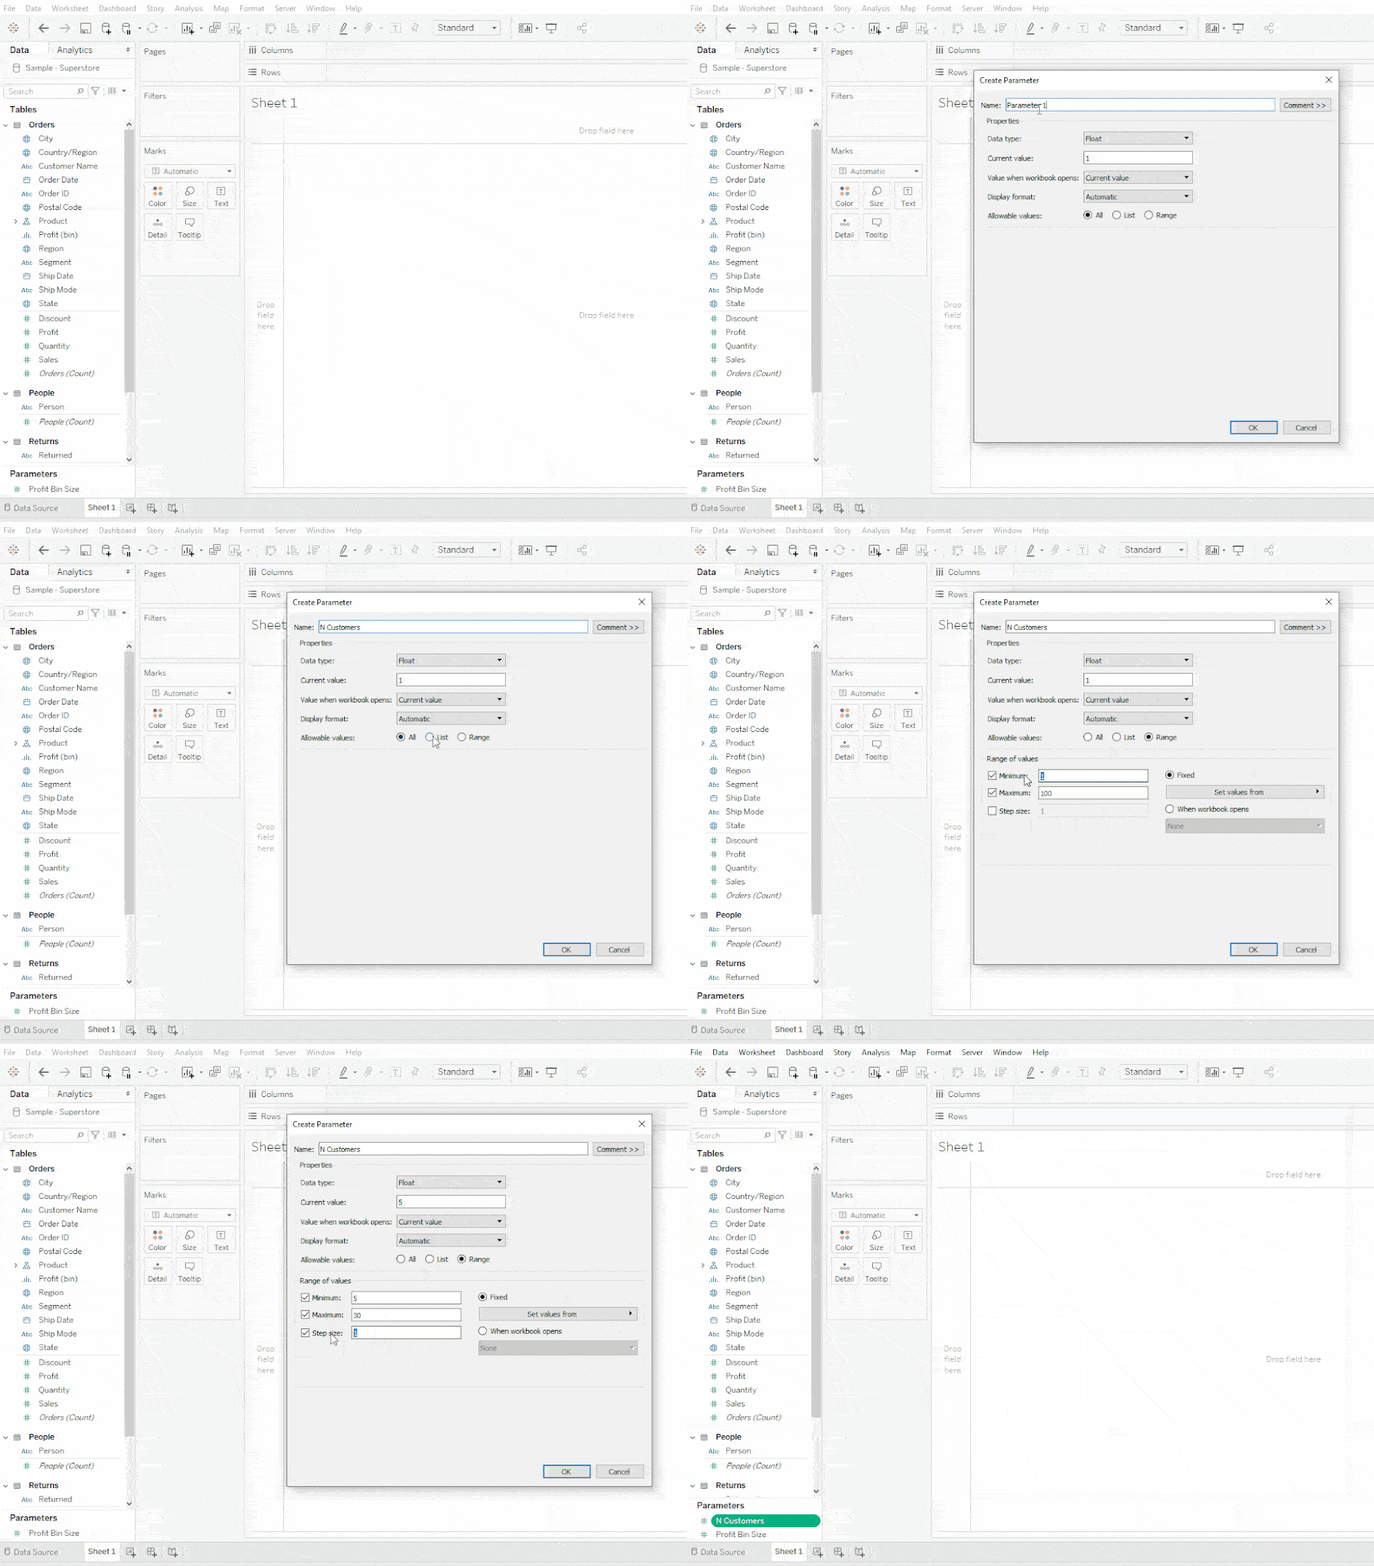
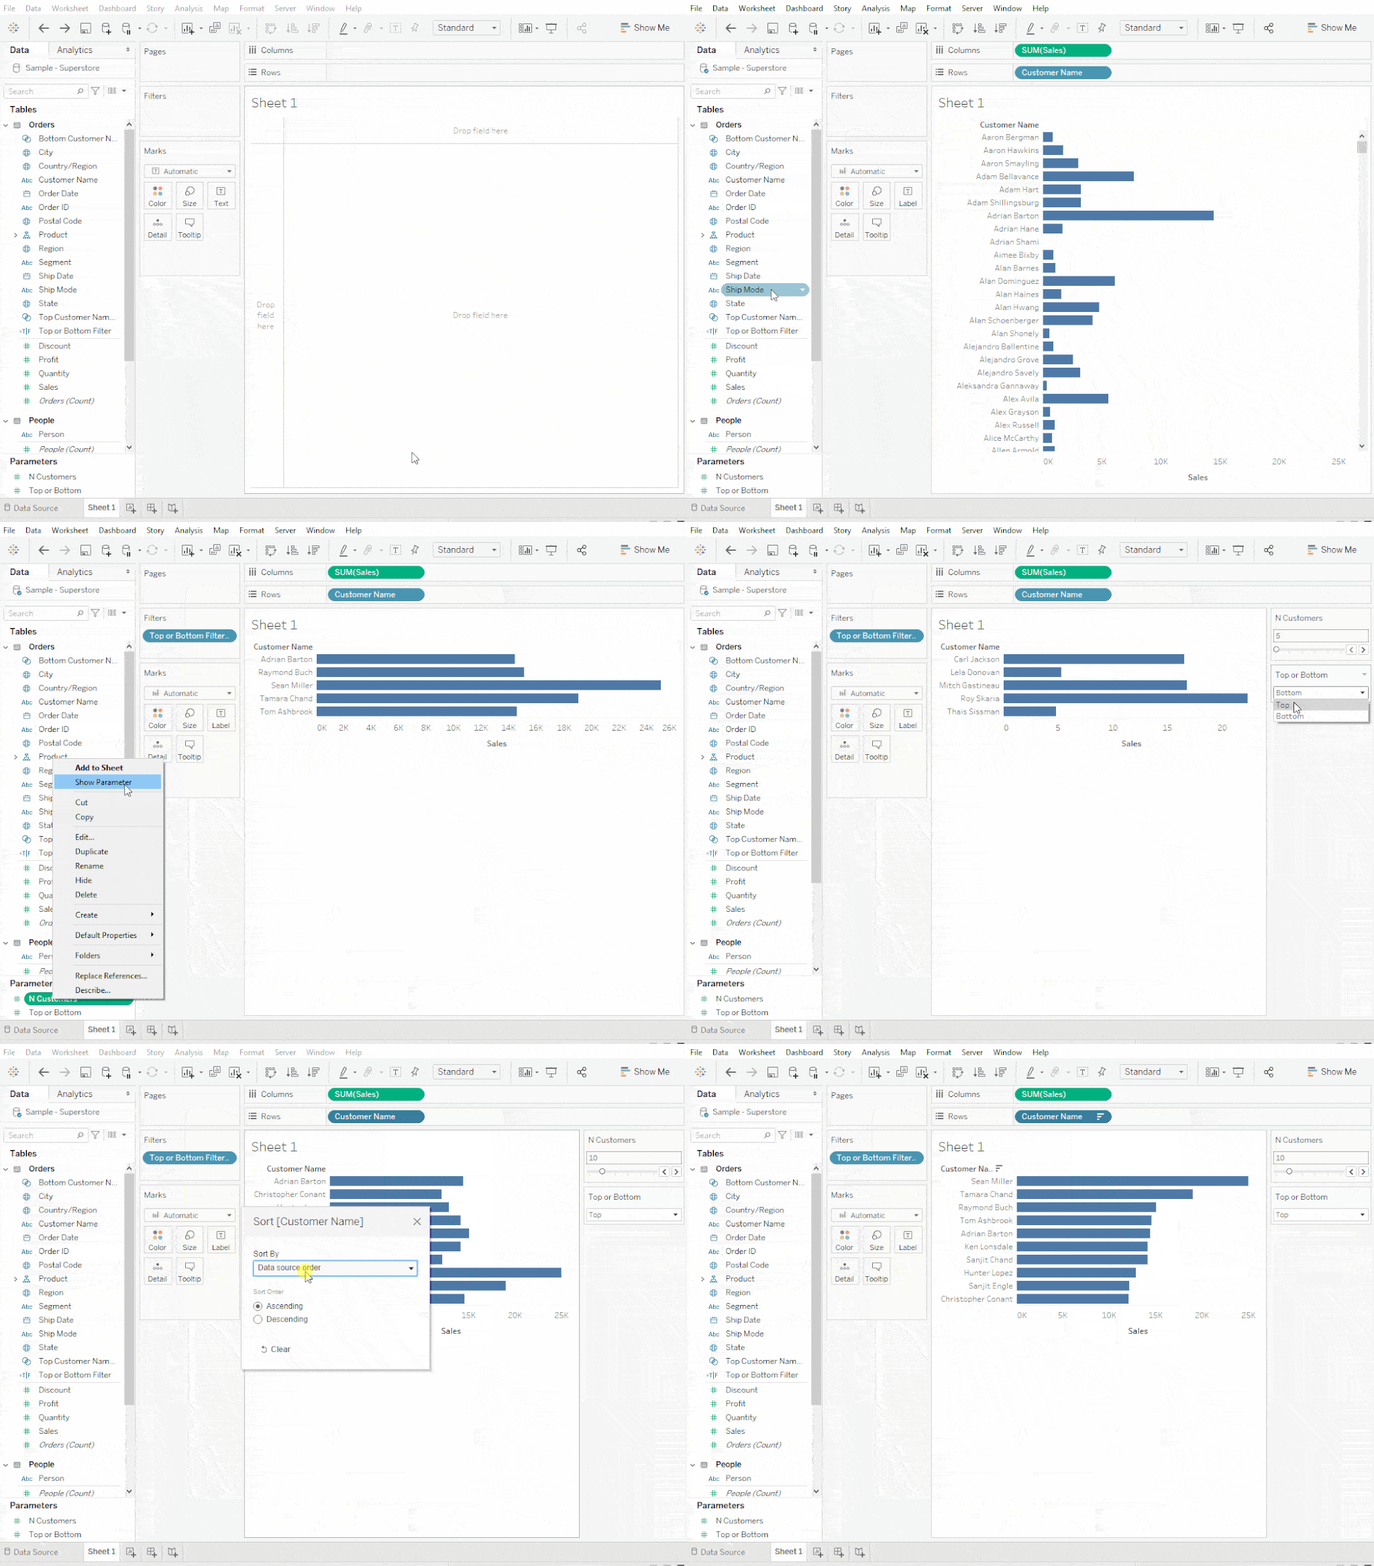
Step #1: Created a Number Parameter
Add a ranged parameter to control how many customers to display.
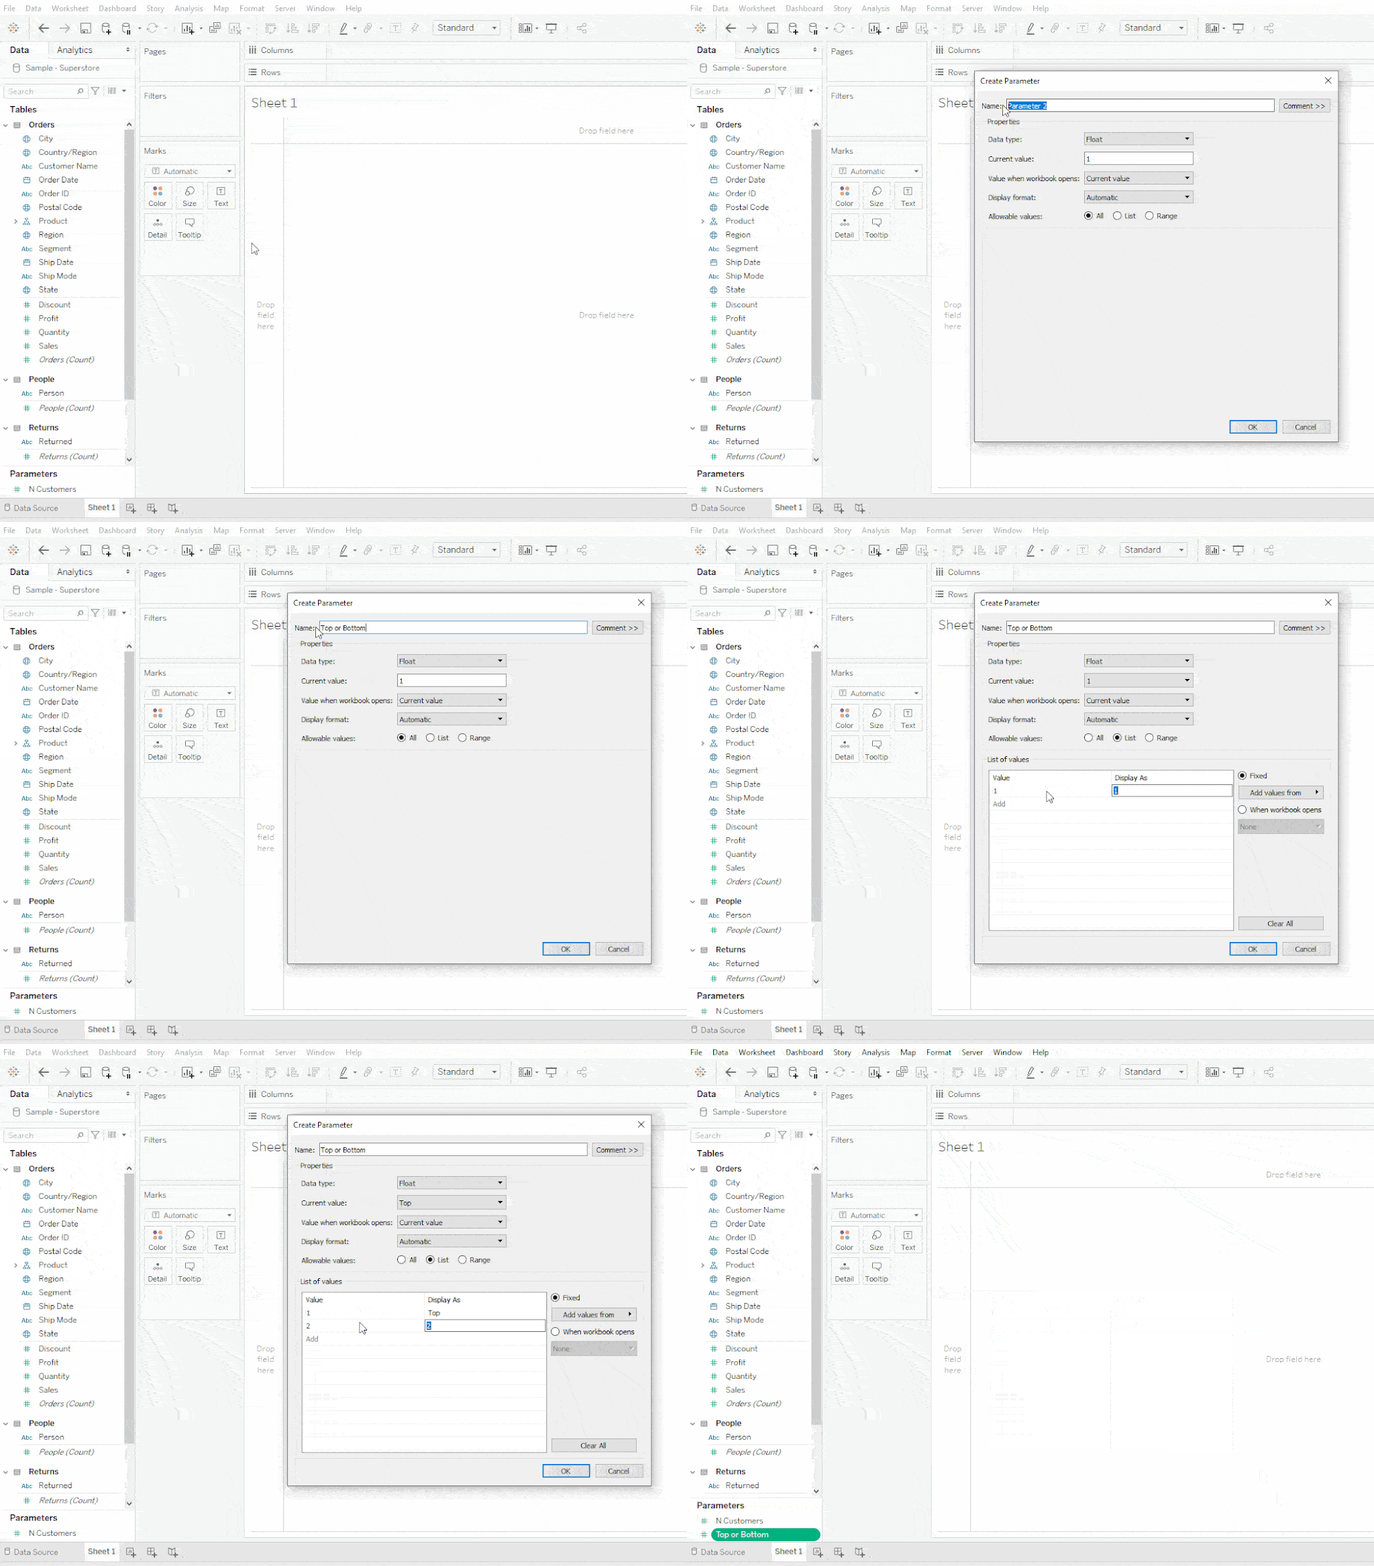
Step #2: Create a Top or Bottom Parameter
Add another parameter to allow the user to select if they want to see the Top or Bottom of the list.
Pro Tip: To help performance, Tableau suggests using a numeric based parameter with lists, as opposed to strings: Use parameters for conditional calculations
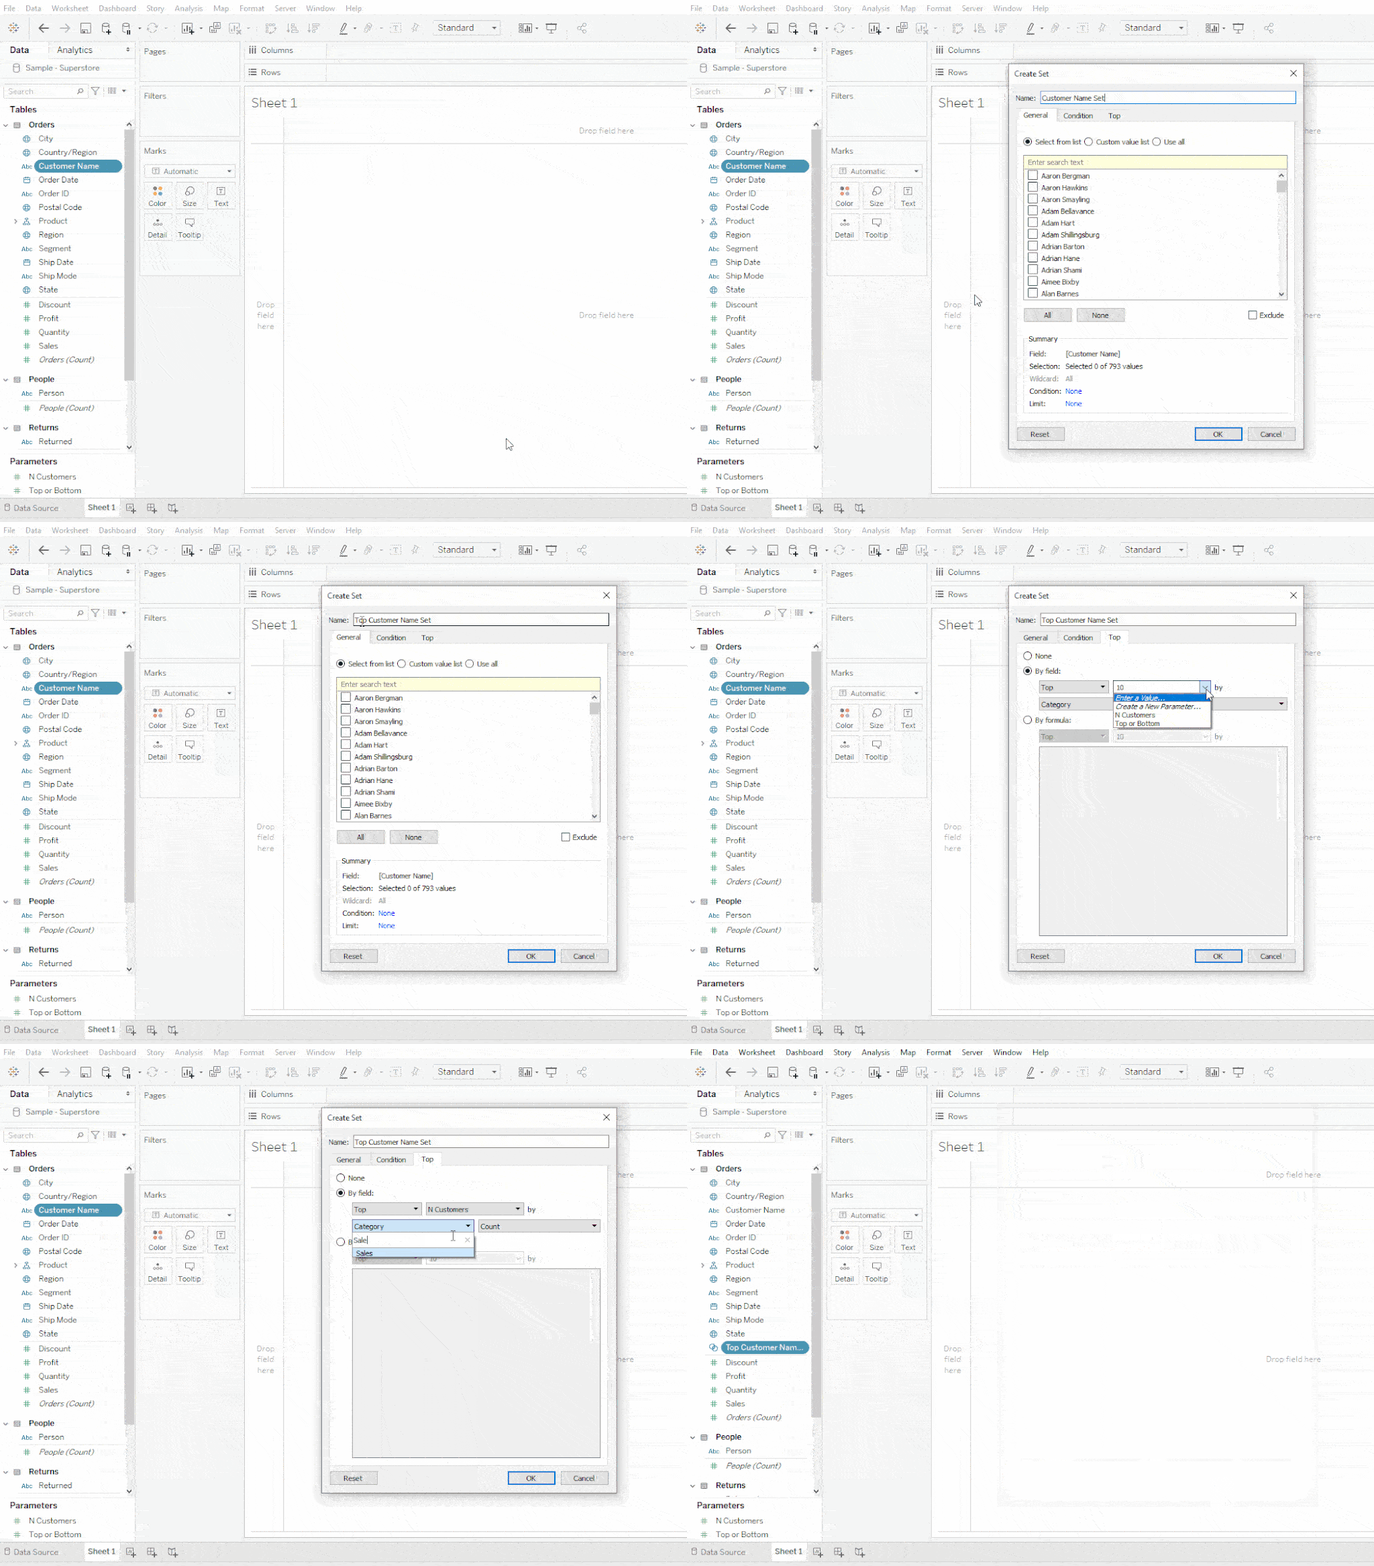
Step #3: Create the Top Customer Set
- Right Click on Customer Name > Create > Set
- Rename the Set to Top Customer Name Set
- Go to Top Tab
- Select By Field
- Change the number to the N Customer Parameter
- Change the metric to Sales
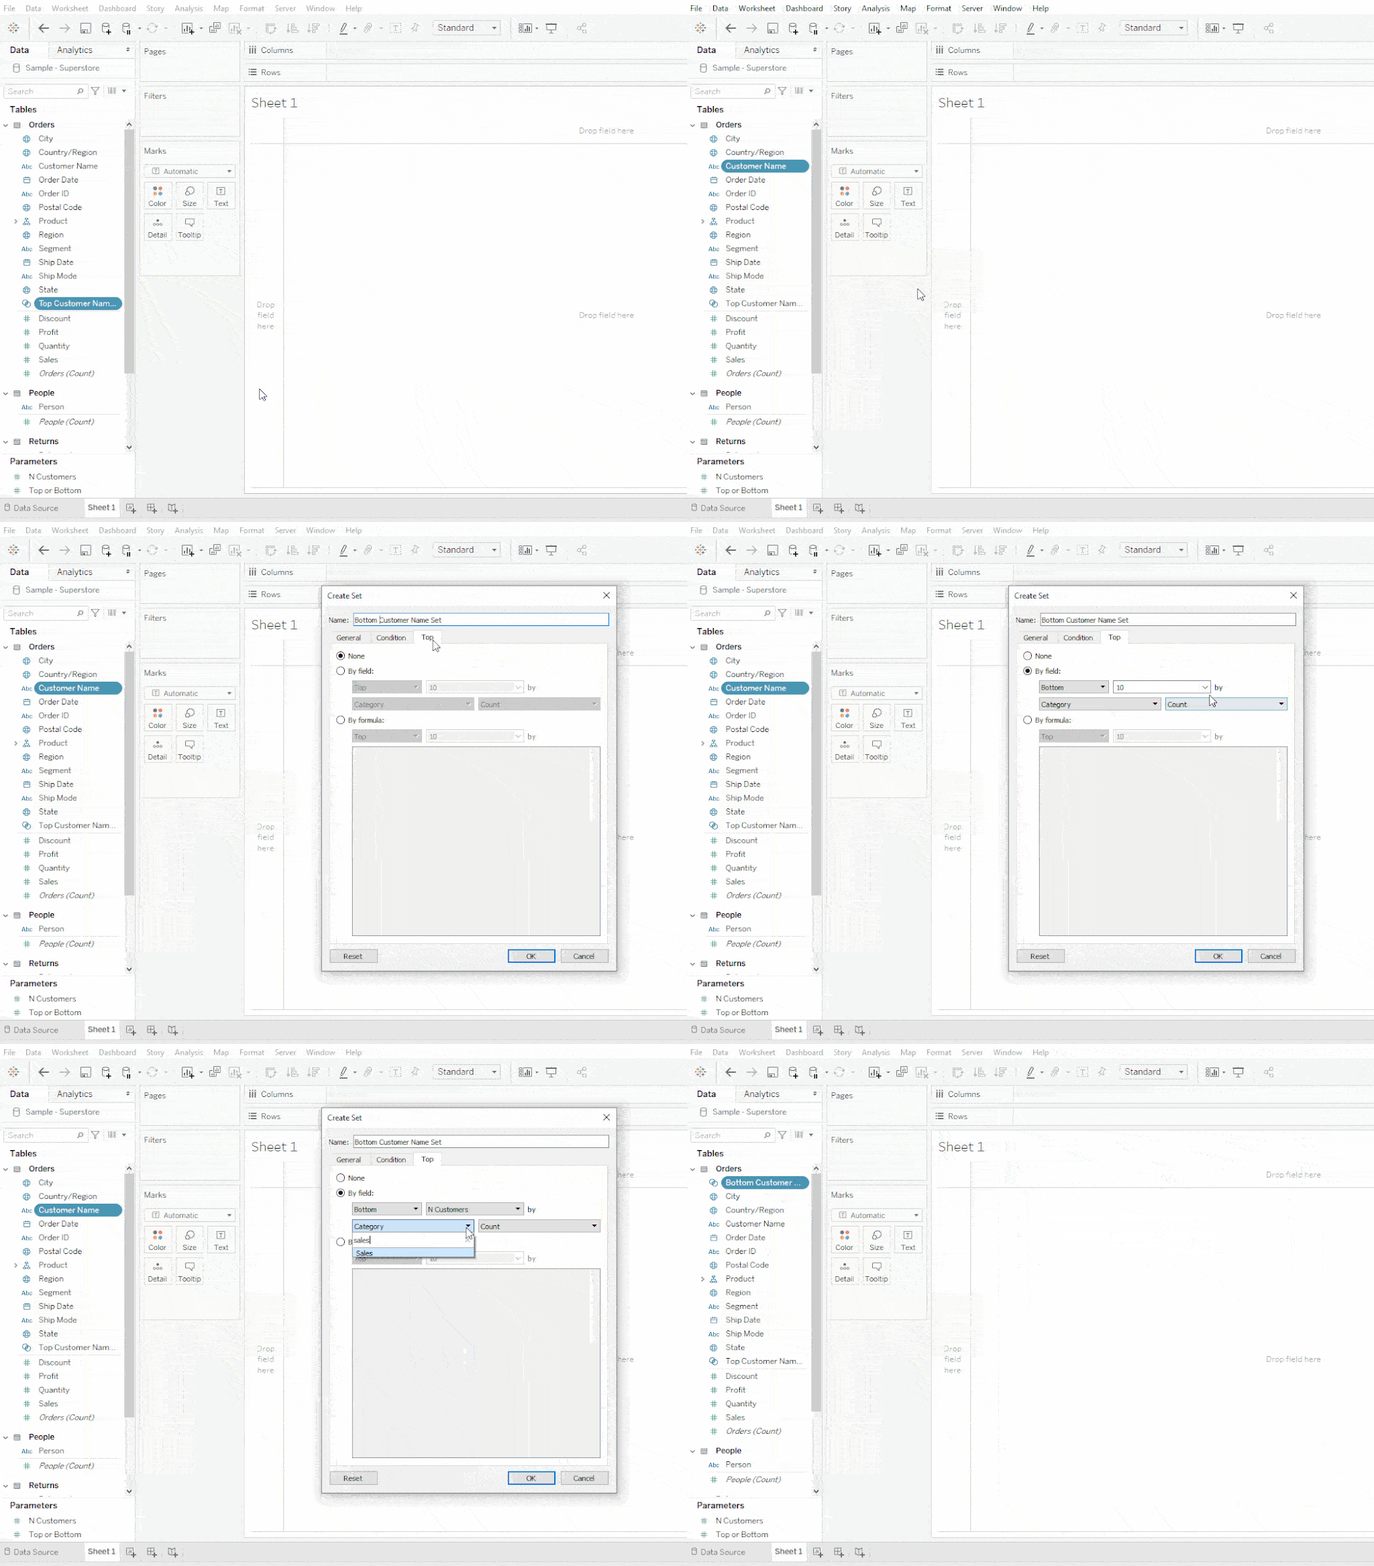
Step #4: Create the Bottom Customer Set
Follow the same steps, but this time select Bottom instead of Top in the Top Tab
- Right Click on Customer Name > Create > Set
- Rename the Set to Bottom Customer Name Set
- Go to Top Tab
- Select By Field
- Change the number to the N Customer Parameter
- Change to Bottom
- Change the metric to Sales
Step #5: Create a Top or Bottom Filter
Sets work by categorizing items as either In or Out of the set. Therefore, we can use the set like a True/False calculation. So this calculation in laymen’s terms is “When the Top or Bottom parameter is set to 1, show all the customers that are categorized as “in” the “Top Customer Name Set”.
					//Top or Bottom Filter
CASE [Top or Bottom]

when 1 then [Top Customer Name Set]
when 2 then [Bottom Customer Name Set]

END

Step #6: Create the Bar Chart
- Add Customer Name to Row
- Add Sales to Column
- Add the Top or Bottom Filter
- Select True
- Add N Customer & Top or Bottom Parameter to the sheet
- Optional: Sort bars by Sales
Create a Top AND Bottom Set
Next, we’ll create an option to show the Top and Bottom items on the same sheet.
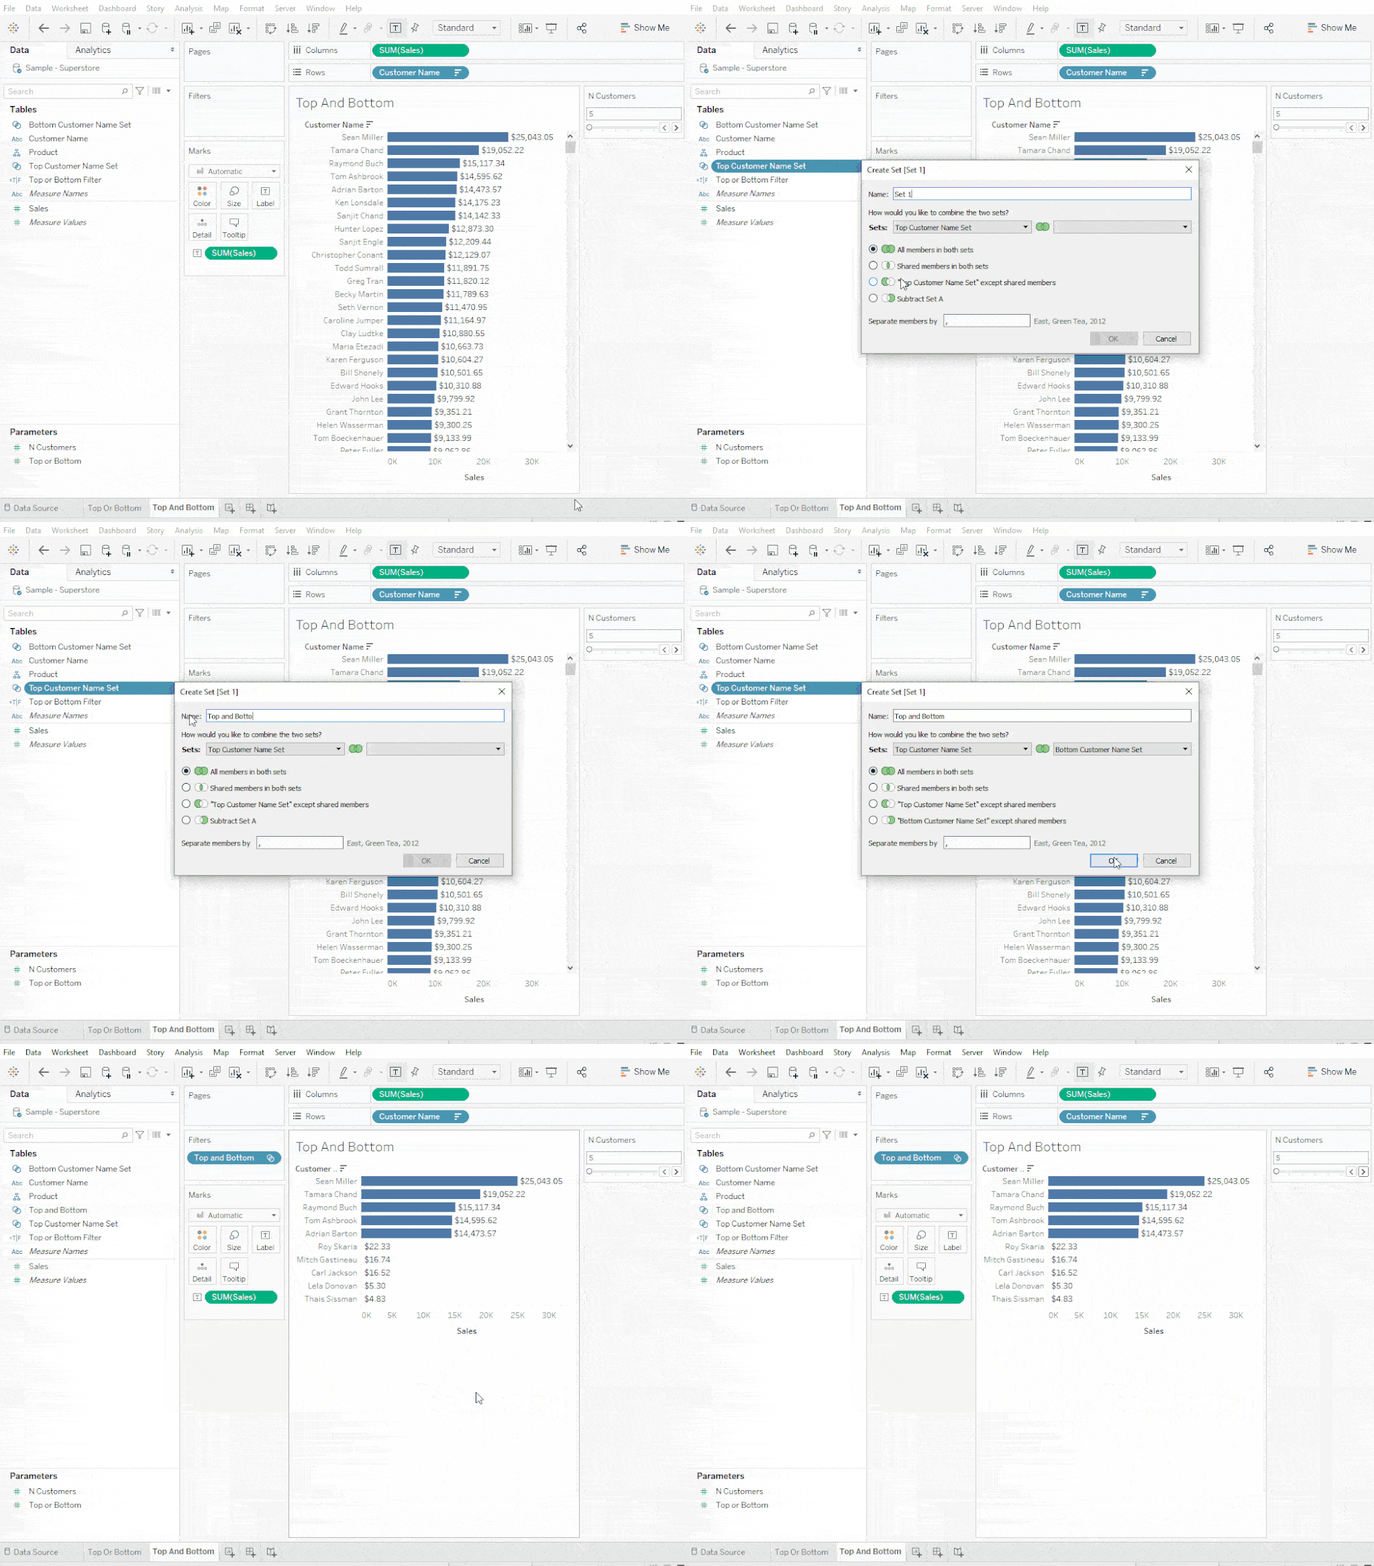
Step #7: Create a Combined Set
- Right-click on the Top Customer Name Set
- Select Create Combined Set
- Rename the set to Top and Bottom
- Select the Bottom Customer Name Set
- Make sure All members in both sets is selected
- Add the Top And Bottom set to the filters
Step #8: Add a Label
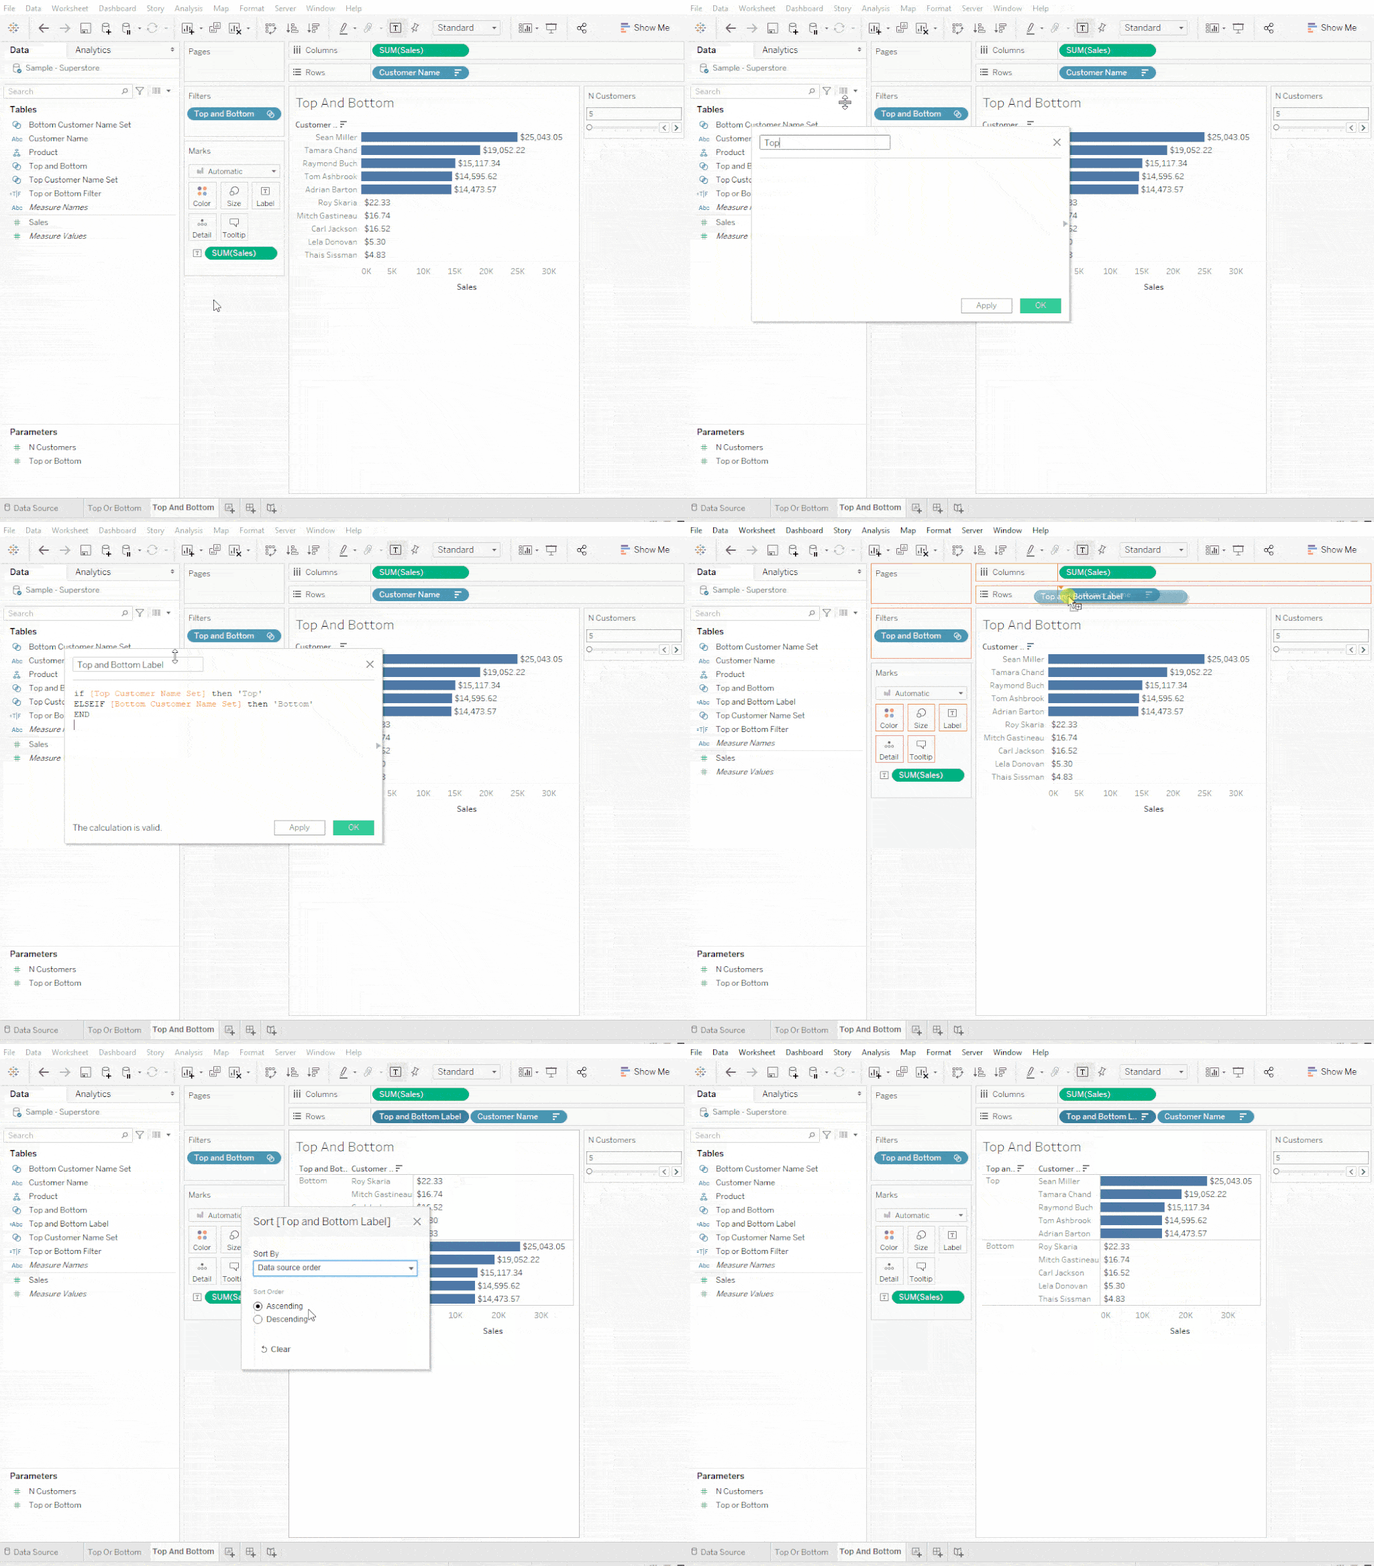
To help the end user know what is being distinguished, let’s add a Top and Bottom label.
					//Top and Bottom Label
if [Top Customer Name Set] then 'Top'
ELSEIF [Bottom Customer Name Set] then 'Bottom'
END
Create Top, Bottom, and Other
Top and Bottom are great, but it can be good how those groups compare to everyone else. Do you have some rockstar customers that are skewing the results? To help gauge this, we’ll add an average for all the other customers.
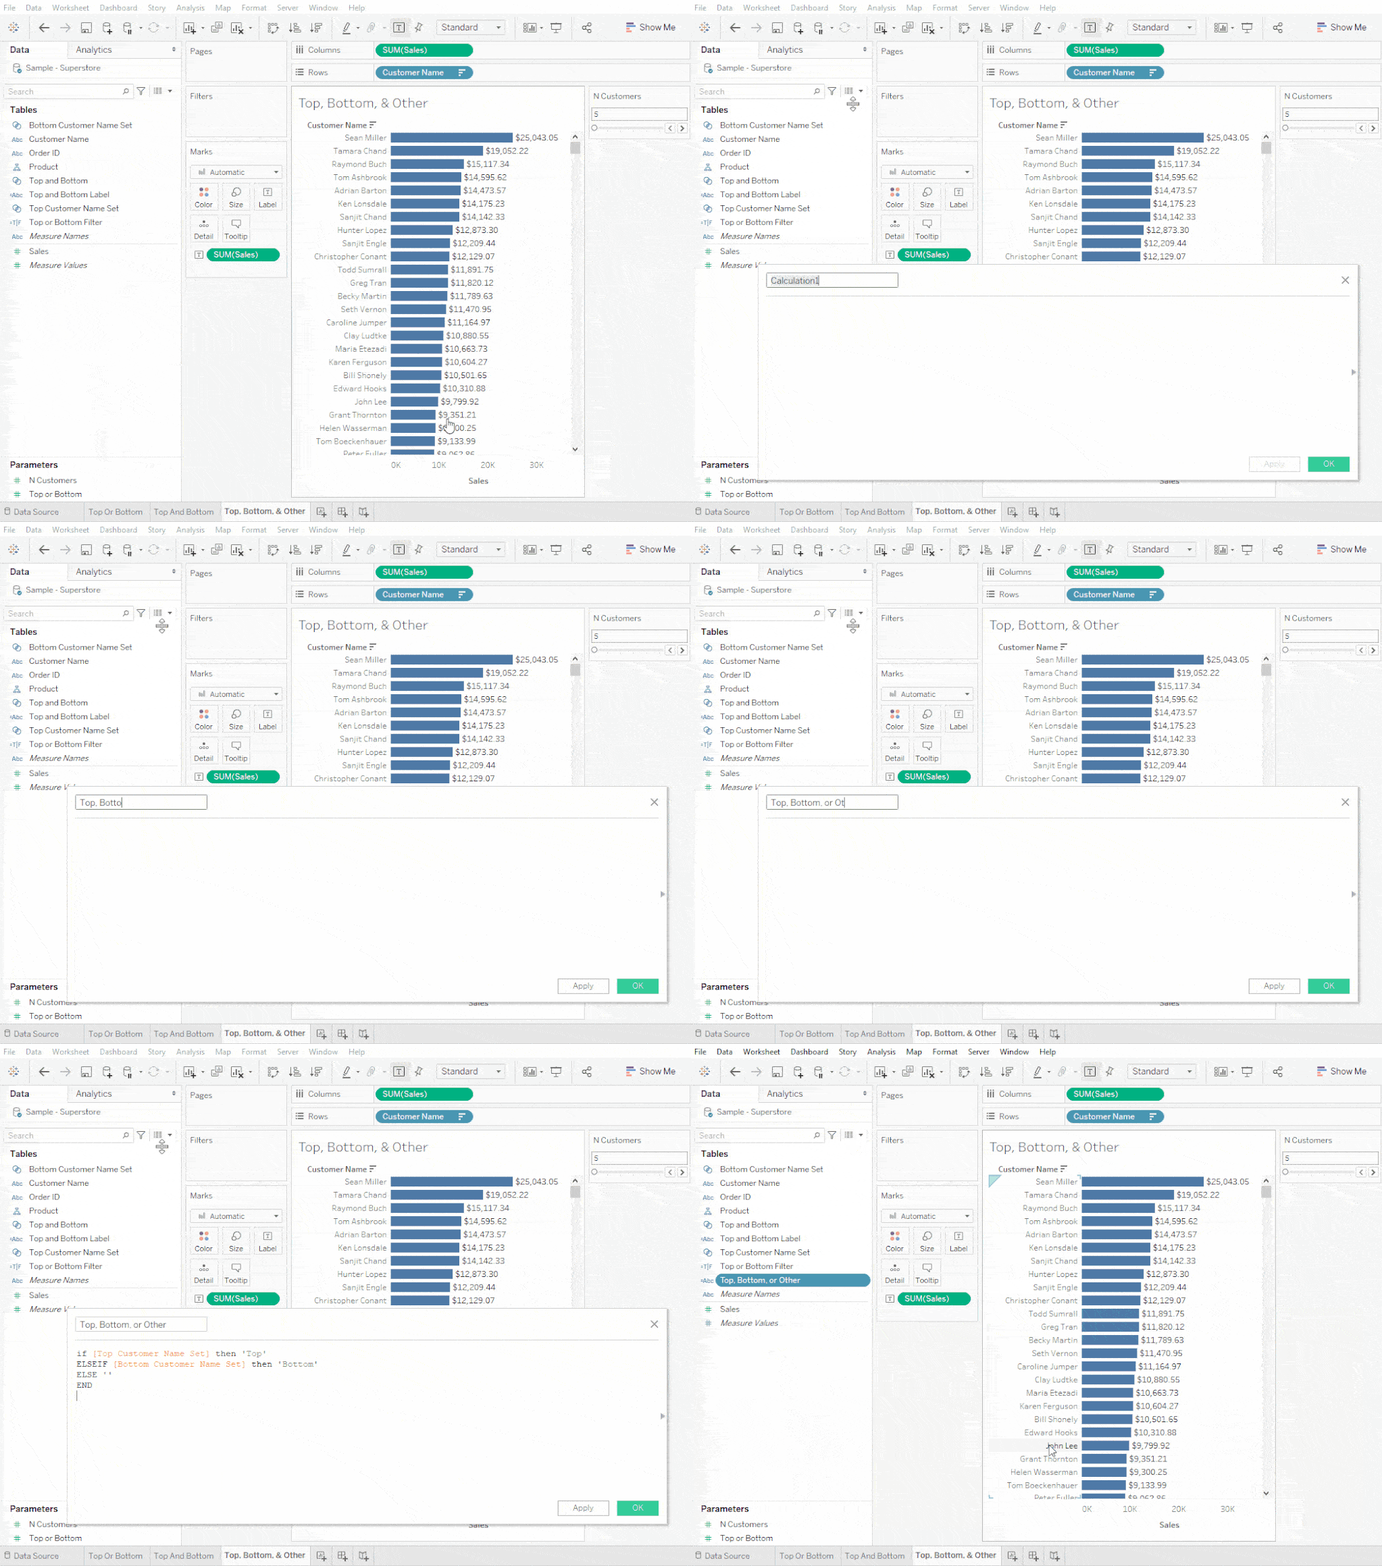
Step #9: Create a Top, Bottom, or Other Label
					//Top, Bottom, or Other Label
if [Top Customer Name Set] then 'Top'
ELSEIF [Bottom Customer Name Set] then 'Bottom'
ELSE ''
END
Step #10: Create a Customer Name Label
Next, we want to create a calculation that will display the customer name if they are in the top or bottom group, otherwise, label it as “Other Customer’s Average”.
					//Customer Name Label
If [Top and Bottom] then [Customer Name]
else "Other Customer's Average"
End
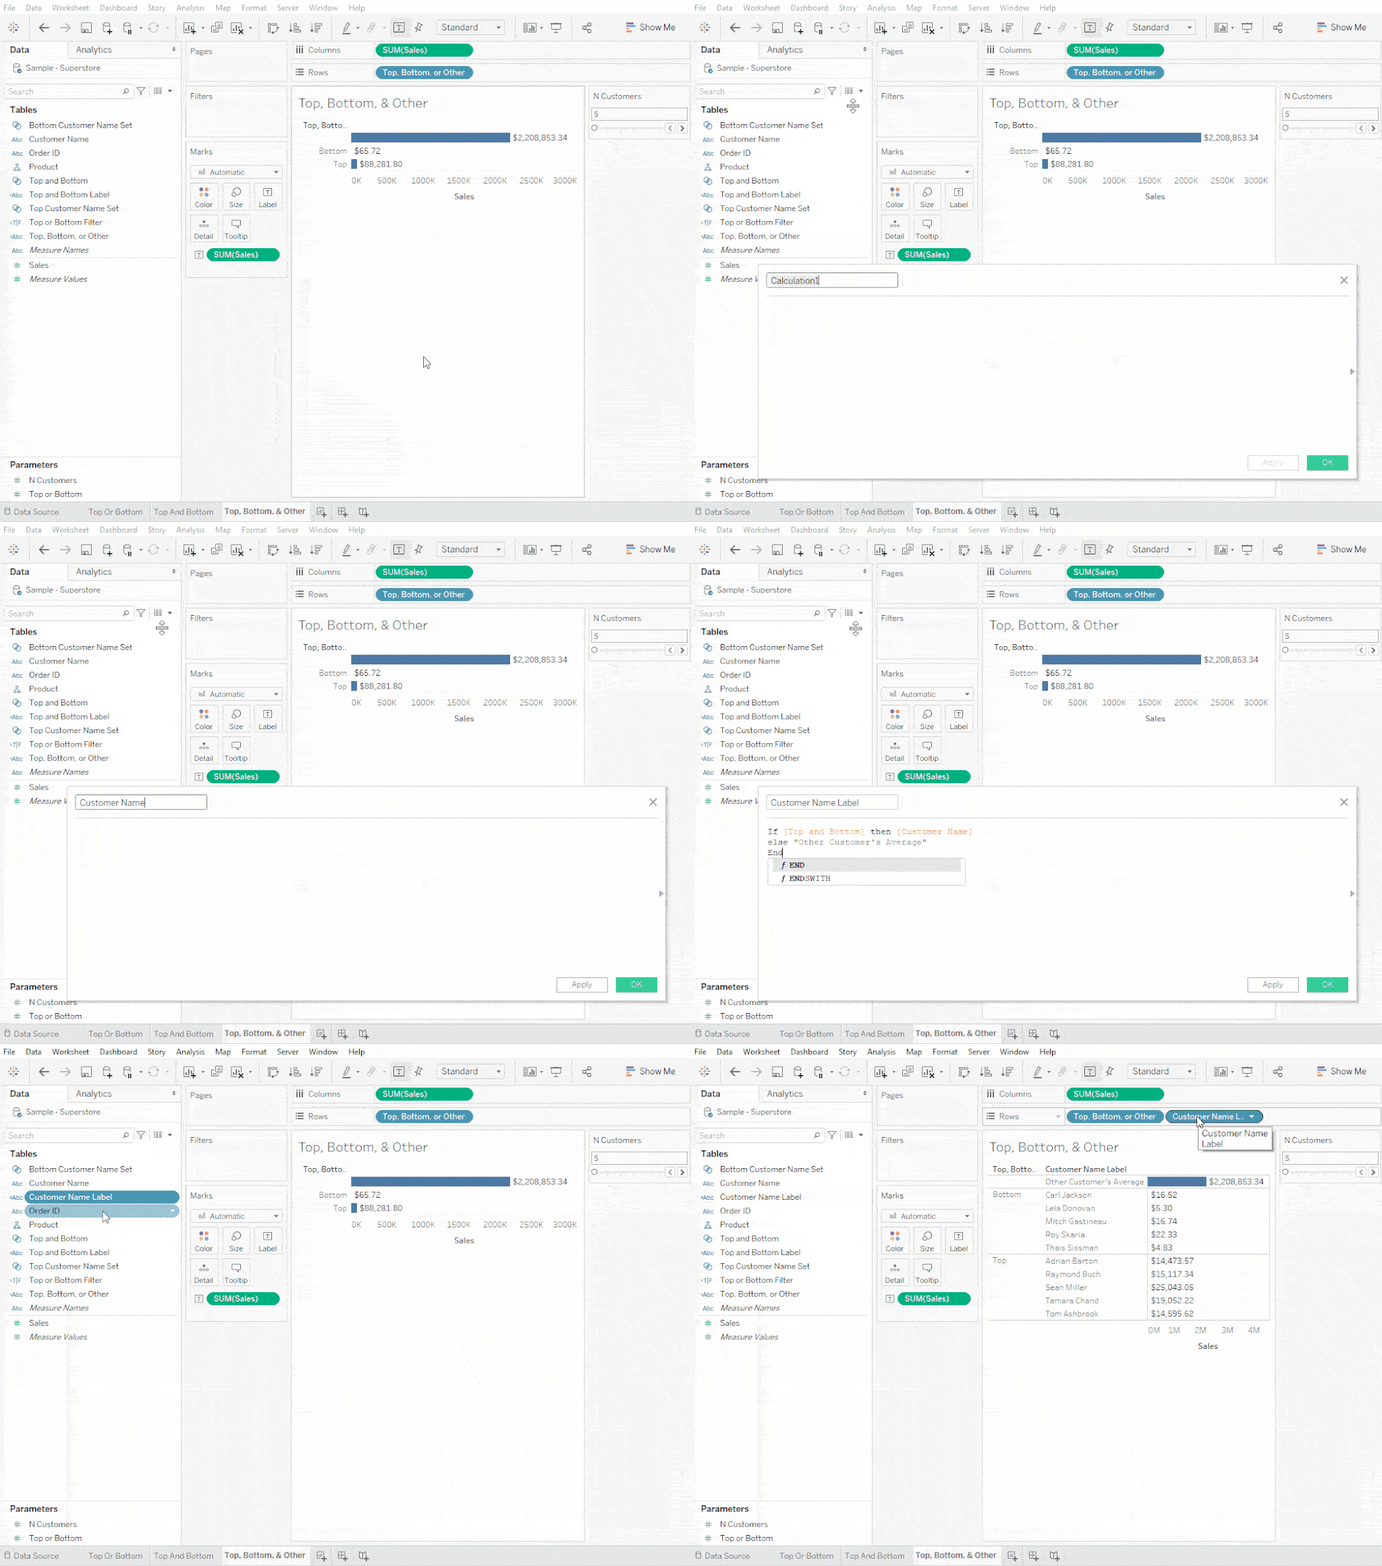
Step #11: Create Top, Bottom, or Other Sales Calculation
Next, we need to address how Tableau should aggregate the Other Customer sales. Right now, it is summing all their sales, but we want to show an average. (If you prefer to show a total instead of an average, you can skip to the next step.)
					//Top, Bottom, or Other Sales
if [Top and Bottom] then { FIXED [Customer Name]:SUM([Sales])}
ELSE { FIXED [Customer Name Label]:AVG({ FIXED [Customer Name]:SUM([Sales])})} END
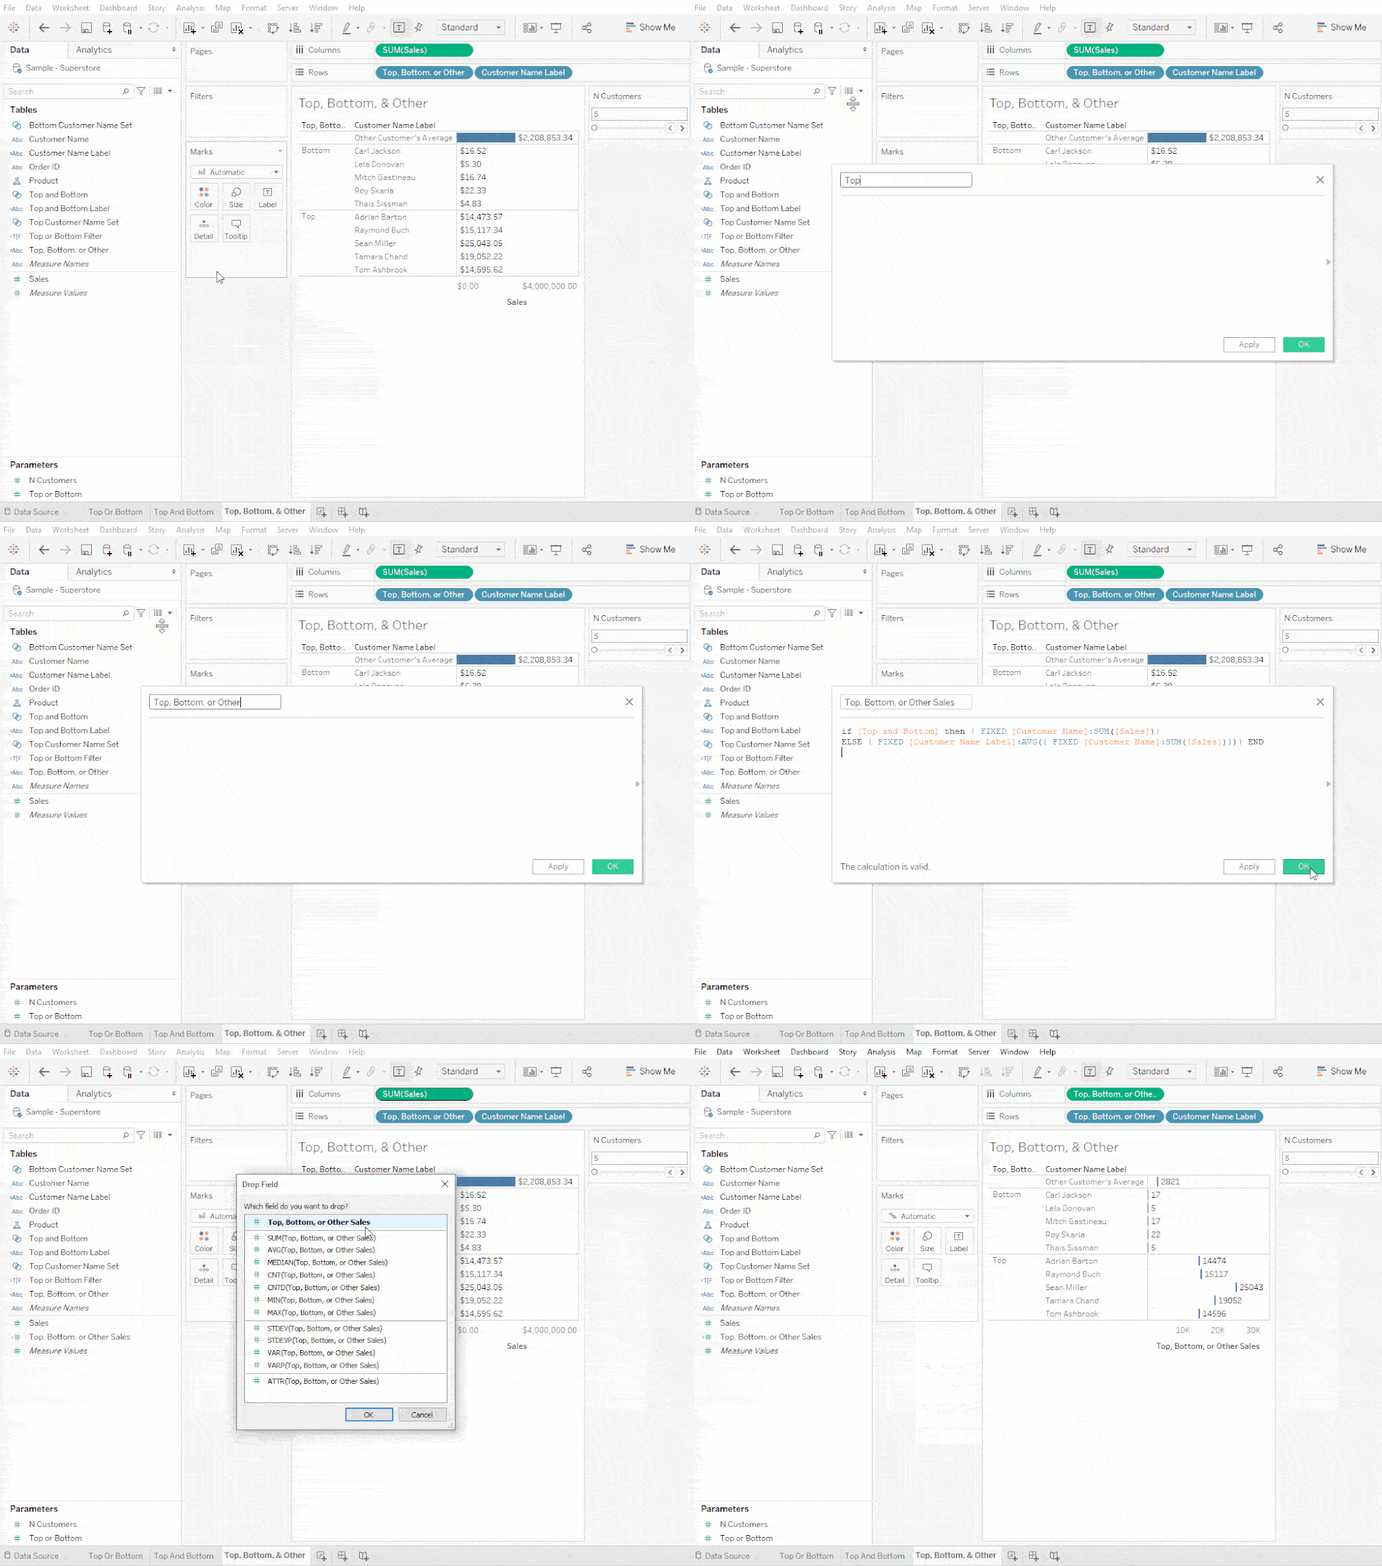
Step #12: Formatting
The last step is formatting the visualization. The main part is making sure the items are sorted correctly. For the Top and Bottom Label, manual. Then sort the Customer Name by the sum of sales. Here is more information about sorting in Tableau: Sorting in Tableau
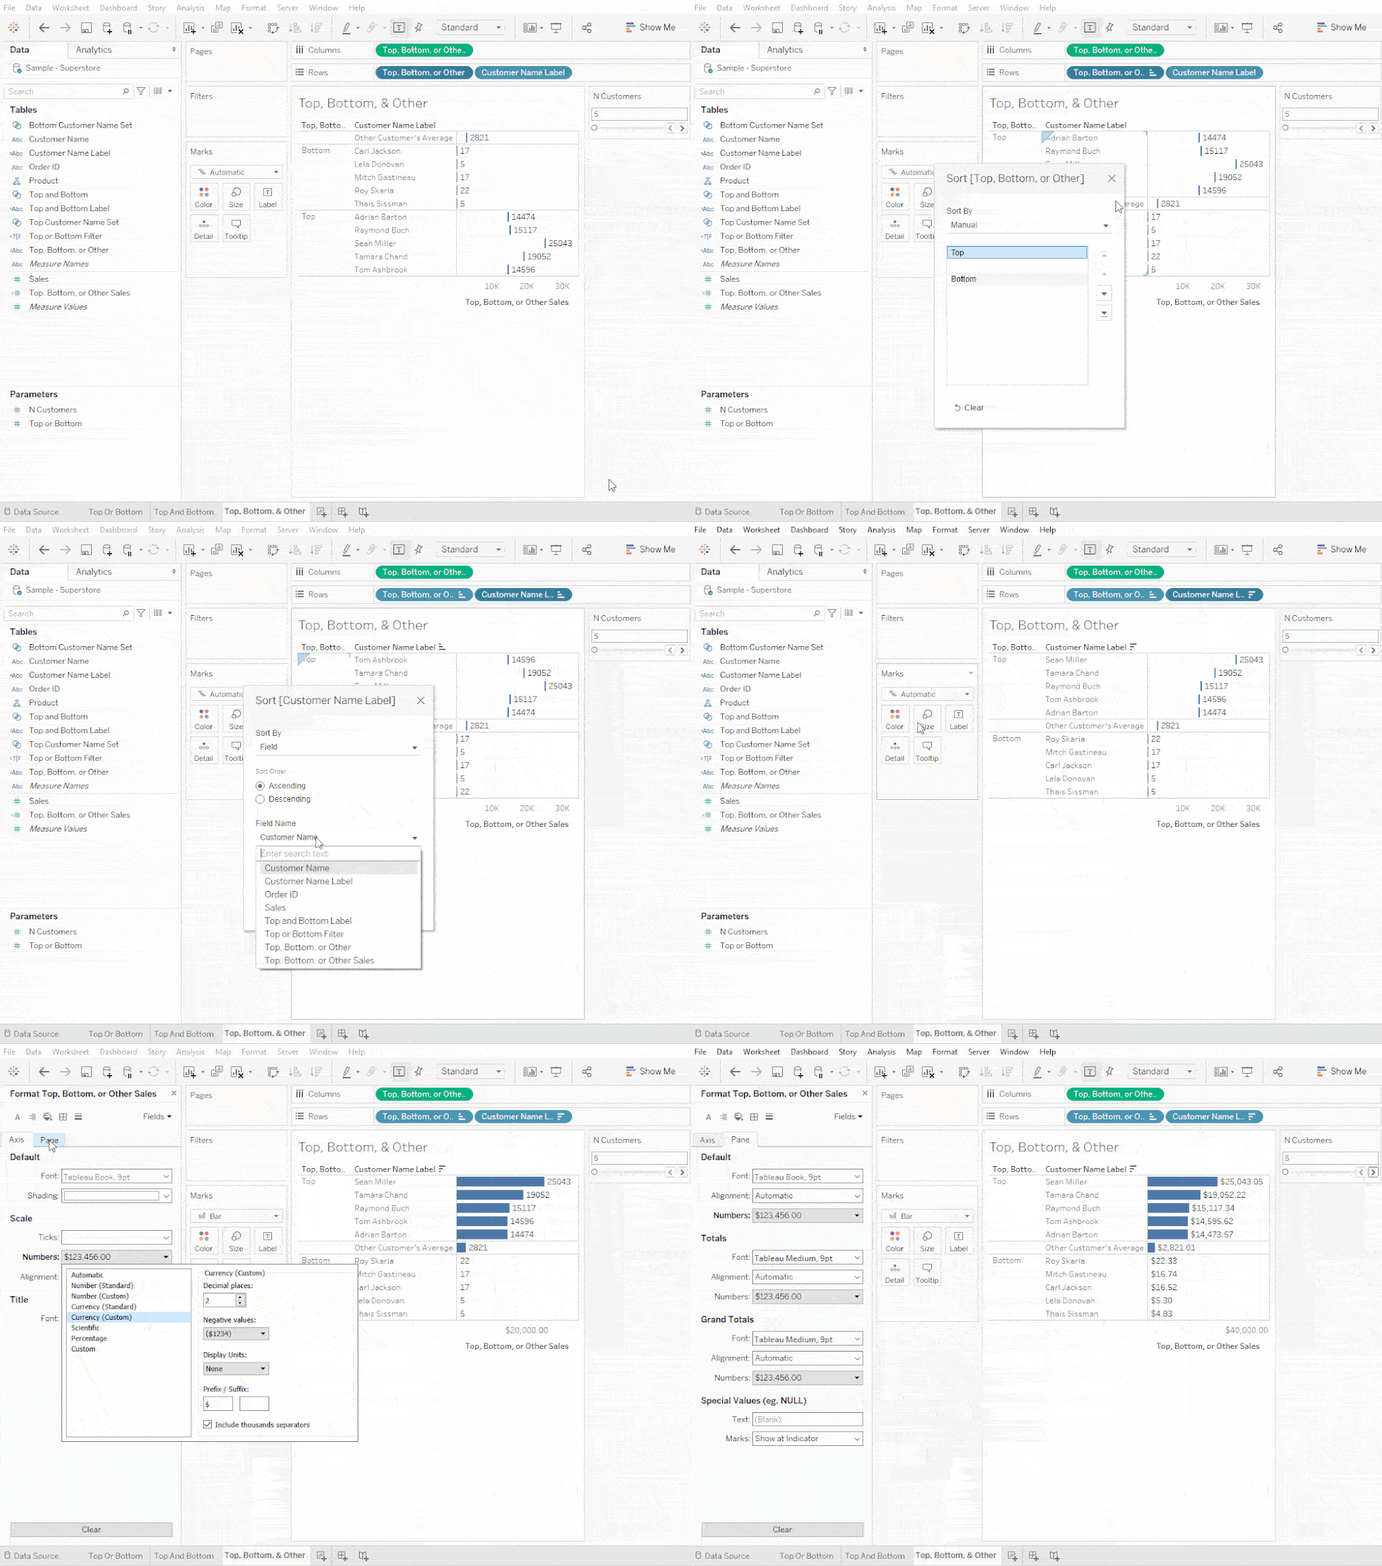
Need more help making your Tableau dashboards a work of art? Our knowledgeable team of Tableau experts is here to help!


