Whether it is on search engines or social media sites, digital ads have become the new standard for spreading the word about your business, products, or services. Now more than ever, advertisers need to have a holistic understanding of the performance of their digital ads and the campaigns and keywords that are driving them.
This dashboard is built to give advertisers an understanding of exactly how their digital ads, in this example, search ads, are doing in terms of impressions, clicks, and converts/acquisitions, as well as how cost-effective they are in each of those terms.
Who This Dashboard is For?
This dashboard is built for digital advertising managers who need a rounded understanding of their search ads’ performances. These individuals need to understand:
How their ads are performing holistically
How each campaign is doing, especially relative to their spending
Where they are driving the most impressions, clicks, and conversions
Which keywords are growing or currently delivering the most value
With a better understanding of the performance of each of these, advertisers can make informed decisions about how they invest their advertising dollars.
What You Can Accomplish With This Dashboard
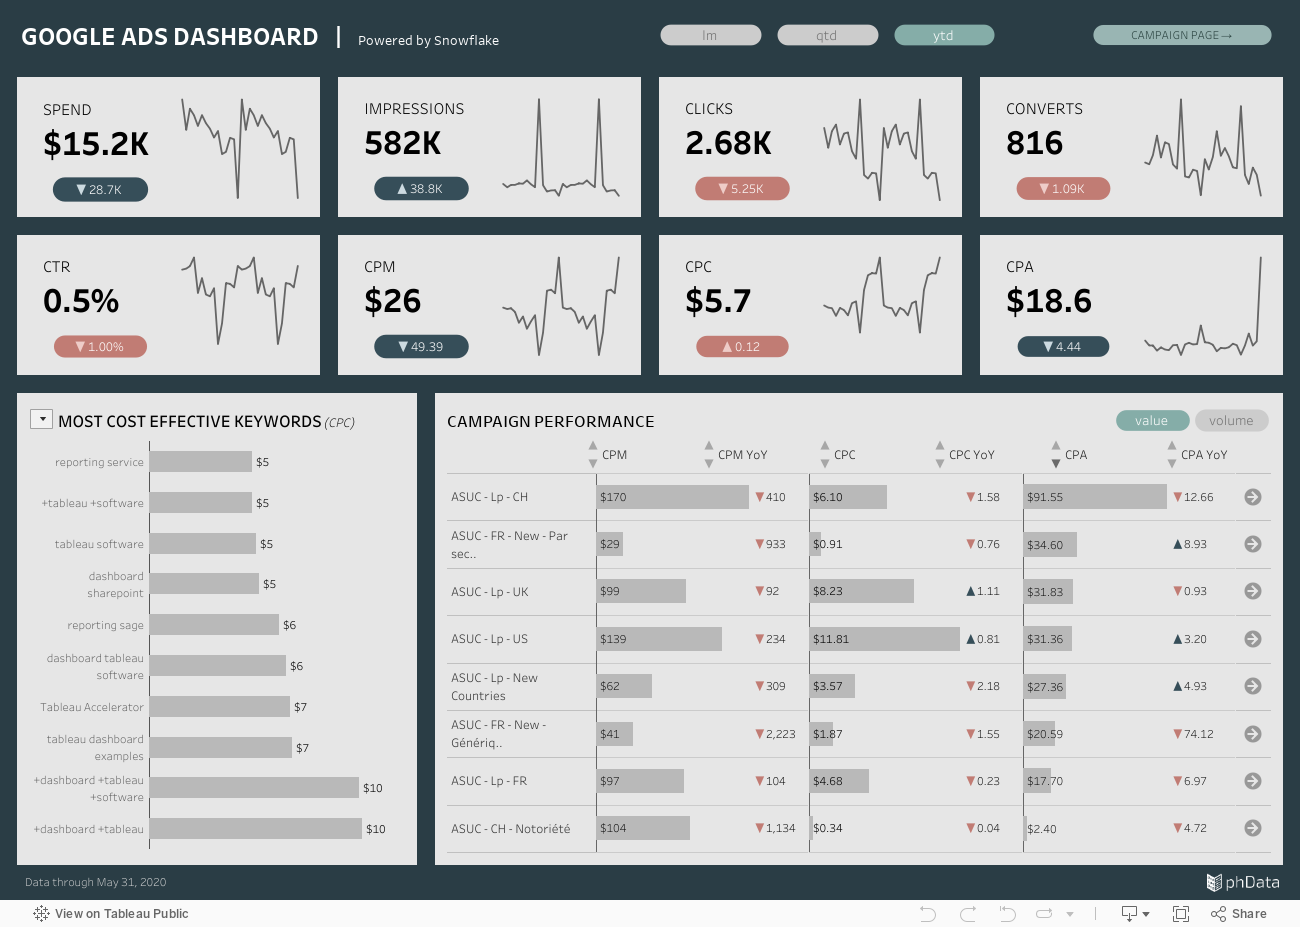
On the main page of the dashboard, you can get an overview of your spending relative to performance through the top of the page, seeing both in terms of value and volume your impressions, clicks, and conversions. On the bottom half, you can drill further into what is driving that performance by looking at high-value, cost-effective, or growing keywords. You can also get a holistic view of campaign performance and sort by your chosen metrics to identify top and bottom performers.
You can follow your analysis path on that campaign by either using the top navigation to go to the campaign page or by selecting the arrow on the row of the campaign you are interested in – doing so will automatically filter the page to your desired campaign. From here, you can view trends for each of your metrics by both each individual keyword and ad group within the specified campaign.
Conclusion
We hope you found this dashboard useful in your pursuit to better understand and identify ad performance within your company. If you have any questions, need help, or are interested in having a team of Tableau experts design dashboards for you, feel free to reach out!