I recently posted a blog titled Web Scraping in Power BI that showed users how to connect to web data in Power BI using a report that I built on the Chicago Bulls dynasty as an example. While the technique I shared is still valid, thanks to the encouragement of Alex Powers, I dug deeper into how I could automate this process even more. Here is a step by step tutorial on how to streamline my original web scraping process using parameters and custom functions in Power BI.
Step 1. Review of Previous Technique
In my previous blog, I outlined a technique for connecting to the web from Power BI that included creating a new query for each individual season that I wanted to analyze. Since the website was in the structure of “www.websitename/season.html”, my previous approach created a new query and for every time I imported a data set I just altered the season number to be season+1, season+2, and so on. Once I brought in all of the seasons that I wanted to analyze, I then used the Append Queries function to Union all of the data sets together to create my final data set. Although this approach does get us to a usable data set, there is a much more efficient way to complete this task that might just give you the goosebumps!
Step 2. Looking At Our M Query
First off, let’s open the .pbix file for my original Chicago Bulls report. If you want to go download the file you can go to this link, and click File -> Download Report.
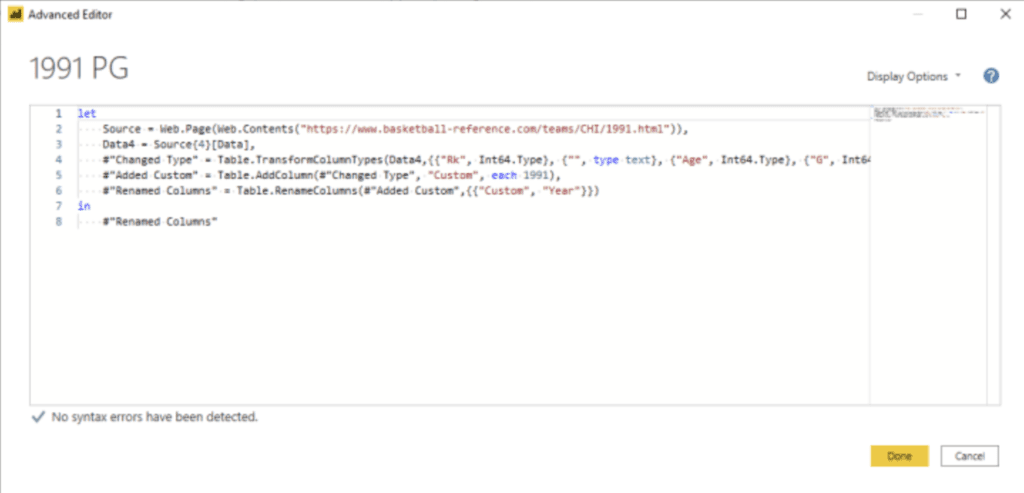
From this same view, select one of the actual Web queries (1991 PG, 1992 PG, etc.) on the left and then click on the Advanced Editor button near the middle left of the Home ribbon (also found more prominently in the View ribbon). The Advanced Editor view will pop up allowing us to see our M code. For those not familiar, M is the name of the Power Query formula language.
The M code below is the query being run to create our final data set. The Source is the web page that we are scraping. The Data4 is the table within that site. The next three lines of code show some of the transformations that have taken place to get the data how I needed it.
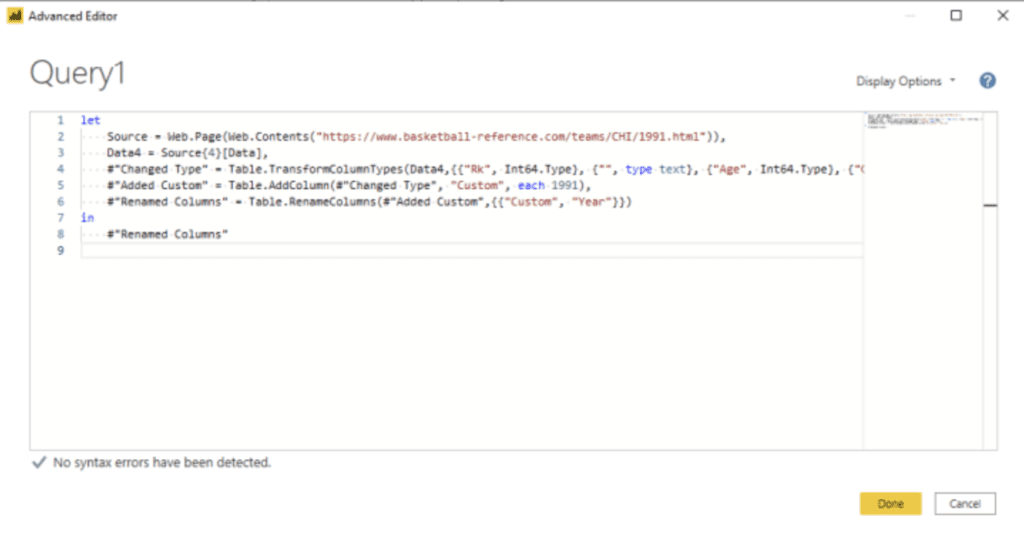
Step 3. Setting Up Custom Function
Now that we understand the M that is being used to scrape the data for one of our seasons, we can create a loop that will pull all of the data in one query.
On the left hand side of the Power Query Editor in the gray area where the other queries currently reside, right click and choose New Query and then select Blank Query. Click on the newly created Blank Query and click Advanced Editor and paste in the M code from the individual season query (same as in the image from the previous section).
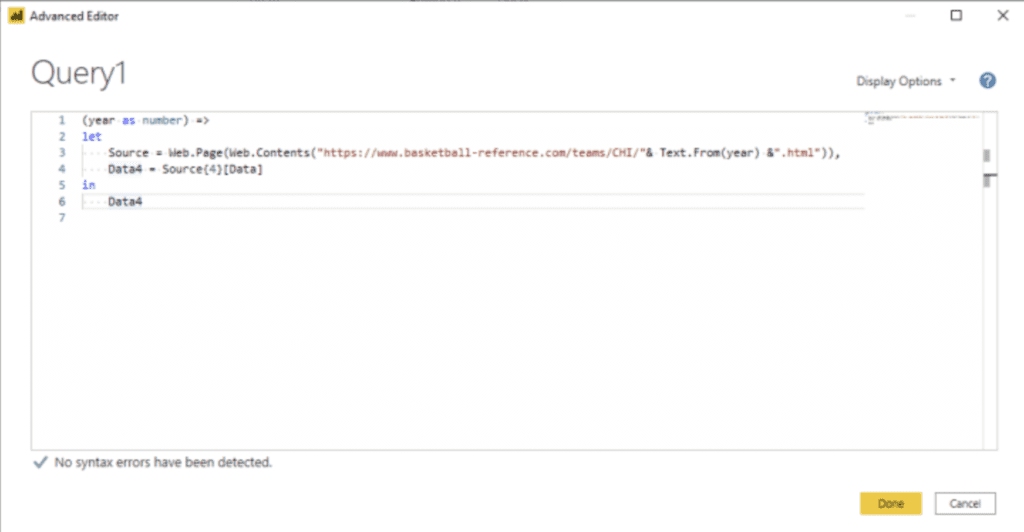
The first piece of code you see is “let”. Click right before that piece of code and hit enter. We want to put something in front of this in the M. Because we are essentially trying to create a loop in the code that will pull in every one of the years we are interested in, we create a parameter called year. To do this, type in the text below as the first thing in the screen.
(year as number) =>
Since we are creating a loop using year, and the year is in the web site name, we need to put the parameter that we just created into the Source name. Make sure to put the year parameter in as text because the rest of your URL is text. You can see the before and after lines below.

Next, delete the transformation steps (they start with #) from your code as we’ll handle those later in a more efficient manner. The last bit of text after the in function may also start with #, so delete this code and replace it with the reference just before it, in this case Data4. Remove the comma right after the code that Data4 is referencing as that will cause an error in your syntax.
Also, just a reminder that M is a case sensitive language, so if you’re having trouble finding parameters or commands, check to make sure you’re using the right case.
After these transformations your M query should look like below:
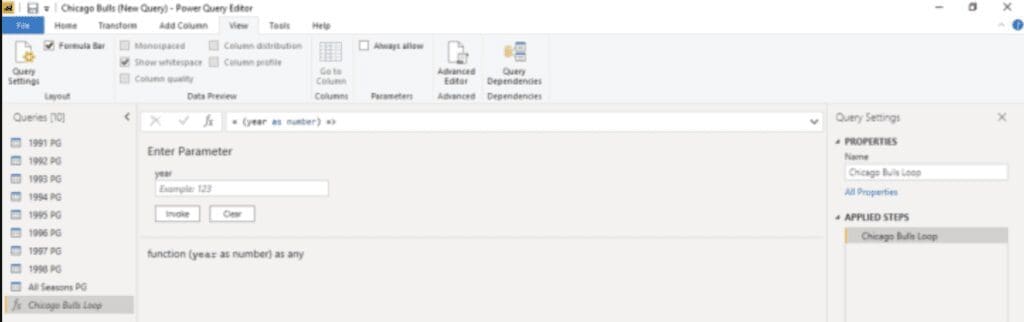
Hit Done. You should now see your function (fx) in the query list in Power Query Editor. You should also be able to see a box where you can enter a value for the parameter year. If you want, you can test out your current code by entering a year value and pressing Invoke. This will create a new query that contains the data from the year you entered. (If you did this, please right click on the newly created query and click delete).
Step 4. Creating Loop
Now that we have our custom function working we need to create the values that the function will loop through.
Right click in the query pane and create another New Query -> Blank Query. Open the Advanced Editor view for this new query. This time you will use the curved brackets {} to create a list of the years that you want cycled through our custom function. The syntax is {year1..year2}. In this example I want to go from 1991 to 1998.

Now that you’ve created this new list click on the To Table button on the left of the Transform tab. A To Table view will pop up, just click OK.
Finally, we need to invoke the function that we created using the list of years that we want to run through it. Go to the Add Column tab and then select Invoke Customer Function button. The view that appears will allow you to choose the function we created in the Function Query drop down. Select our Chicago Bulls Loop and click OK.

By invoking the custom function using our list with the Column1 (which is our year) we will get a result for each row in this list. You will see a table like the one below. Click the button with the diverging arrows in the second column. A list of columns will appear. Just make sure to uncheck the ‘Use original column name as prefix’ box.

The custom function will run and then our new data set will appear! As you can see, the custom function ran with each value in our list and merged all of the data together.

Now, a couple of tidying items. First, let’s double click into the first column header and rename that year. Next, you’ll notice that every column in our data set is formatted as ABC123. We know that the format for Player Name and Points per Game should not be in the same format, so let’s change that. Select the first column then click Ctrl + A. This highlights the entire data set. Next, go to the Transform ribbon and select Detect Data Type. This will scan the first 200 rows of the data and determine what format the data should be in. Although not right all the time, it’s a very helpful tool.
We have now created a data set that we will use for our final report! Very exciting. A couple more things to address because we want to use this new query for my visualization instead of the old query. Just as our original simple Web query had an M code that we could utilize, the query that is the result of our custom function has an M code that we can plug in and get the same outcome. So if we want to replace the previous appended table with our new query, just click on the old table (in this case called All Seasons PG) and open the Advanced Editor view. Copy and paste the M from the new query (below) into the old table. This way, the report that we built will be using the same table but the query will have changed populating that table with the correct data.

Finally, click Close and Apply to go back to your report and check to see if your visualization is working as expected. I always want to make sure my new query is working first before deleting all of the old tables, but once you make sure that the new query is working feel free to go through and delete all the of the tables not feeding your report. And alas, we have a viz scraping numerous web pages and bringing them in as one table.

Thanks so much for reading! Have more Power BI questions? Our team of Power BI experts are here to help!


