As with all systems, Sigma has a specific mindset when applying filters. When learning a new platform, it is important to understand how Sigma thinks about a filtering scenario vs other systems. This is especially important when using date filters. Depending on how you add the filter and how your data element is set up, filters can default to slightly different settings with huge end-user experience ramifications. In this blog, I will review the difference in these default date filter settings and the best way to avoid any confusion caused by the differences. Check out this blog for more information on 2022 Sigma Computing updates.
How do Different Date Aggregation Filter Work?
The most important filtering concept to remember is that Sigma defaults to filtering what you have the element grouped by.
For example, in the image below (red box), when I add a date filter to the bar chart which is grouped/aggregated by a non-date type field (ie a String field – Region), the date filter doesn’t have a predetermined configuration to follow so it defaults to the base value or data source value of the date field.
For example, when I add a date filter the bar chart is grouped by something other than a date so it defaults to the base date field. This is opposed to the pivot table which is grouped by a field that is a date type (blue box) so it defaults to that date field’s configuration i.e. a truncated year.

The filter default difference is important because the bar chart date values range from 2017-12-18 to 2022-02-16 and the pivot table values range from 01-01-2017 to 01-01-2022. And if they have different windows of dates, they will almost certainly have different cost totals.
How Does Sigma Read Dates?
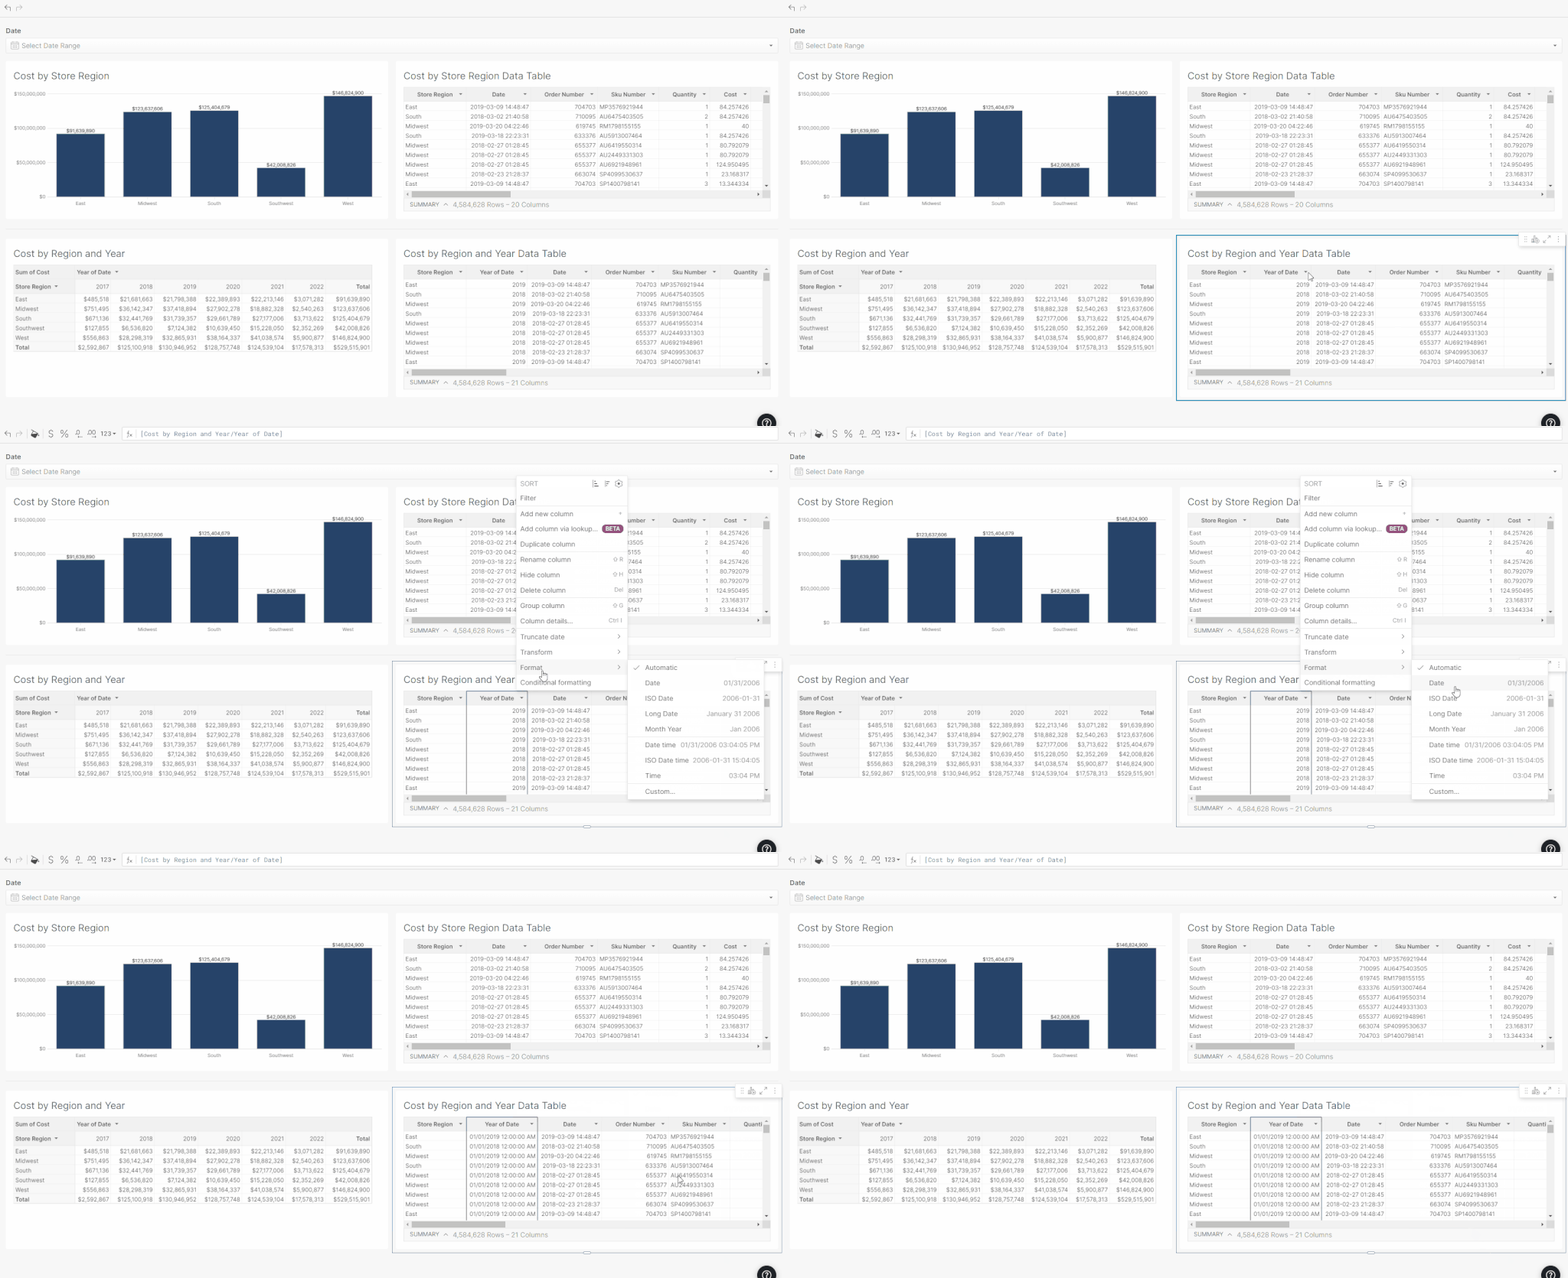
This difference can be better understood by changing the format of the Year of Date to Date Time instead of Automatic (which would only return 2017, 2018, etc). This can be seen in the GIF below.

So if I use the quick select filter to select “Last Year” (I’m writing this in Feb 2022) the dates included in all elements are 1/1/2021-12/31/2021. The result is matching amounts across each Store Region.

To put this technical concept into sentences: In the bar chart, Sigma is asking the Date Column “Is the Date between 1/1/2021-12/31/2021?” In the pivot table, Sigma is asking the Year of Date Column “Is the Date between 1/1/2021-12/31/2021?”
However, if I select last quarter (10/2021-12/2021), the pivot table is going to show no data because everything has been truncated to the first of the year and the most recent quarter started on 10/1/2021.

Again, to put this technical concept into sentences: In the bar chart, Sigma is asking the Date Column “Is the Date between 10/1/201-12/31/2021?” In the pivot table, Sigma is asking the Year of Date Column “Is the Date between 10/1/201-12/31/2021?” Since all of the values in the Year column are January 1 of each year, they do not meet the filter criteria and are excluded.
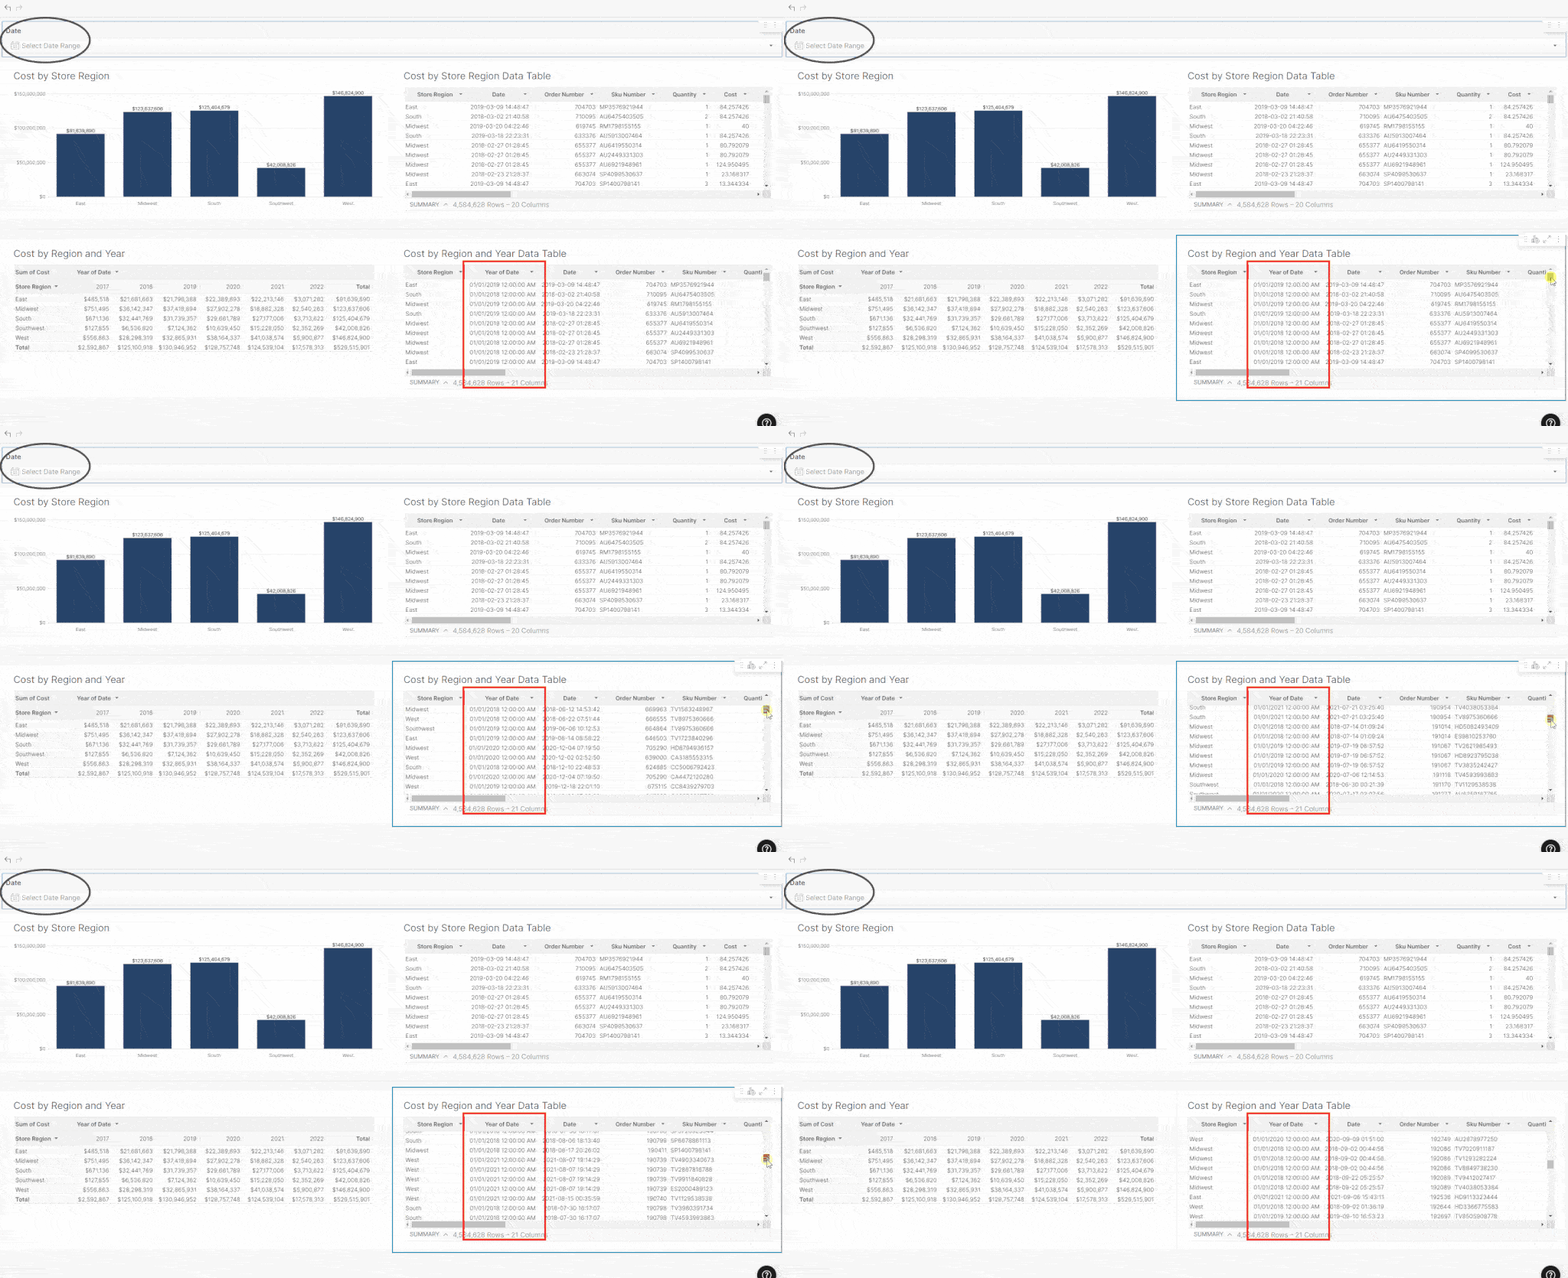
With no date filter applied, we can see the Year column only contains January 1 entries.

But if I select a time period that overlaps January 1, the pivot table will return data for the entire year (because it is truncated to January 1).
So in this example below, the East Regions Sums do not match because the bar chart is using sums from 10/01/2020.-3/31/2021 and the pivot table is summing any rows where the year of date is 01/01/2021 because that is within the filter range.

What if the Date Filter Overlaps the Truncated Date?
Another way to demonstrate the difference is if we change the pivot table to be grouped by Quarter and filter to 4/1/2019-8/31/2019.

In this example, we can see the East totals are different because the bar chart includes less data. The bar chart includes 4/1/2019-8/31/2019. The pivot table includes Q2 -Q3 2019 which translates to 4/1/2019-9/30/2019.
Remember, any August and September entries have been truncated to July, and July is within the filter window.

Pro Tip: The best way to avoid this confusion is to always use the base date in the filter target instead of a date truncation.
As seen in the image below, each filter has been set to filter on the base value of the date which causes each date to be individually evaluated meeting the filter criteria. And this results in the same total spend in each Region.

Conclusion
In conclusion, this subtle setting difference can potentially cause some end-user confusion if not configured correctly. However, it only takes a simple change to correctly apply. To learn more about Sigma best practices reach out to our team of expert consultants!


