

This is Part 3, consider starting at Part 1!
Though Tableau Prep and Alteryx have some differences in breadth and depth of product functionality, many look to the two products for their data prep needs. For that reason, for the next few weeks, let’s compare and contrast the products from the perspective of data prep alone.
In my eyes, the key capabilities of data prep are as follows:
- Input: connecting to your data
- Data Investigation: knowing your data, and what is wrong with it
- Data Cleansing: string manipulation, calculations, filtering, and handling nulls
- Data Joining & Transformation: manipulating the structure with joins, unions, or cross-tabs/transposing
- Output: where to data ends up
In Part 1, we discussed Input and Data Investigation.
In Part 2, we tackled Data Cleansing.
In this post, we’ll get through Joining, Transformation, and Output.
Next week, we’ll talk through some additional functionality, take a closer look at price, and round it with some conclusions.
The Work to be Done
Continuing on with our walk through from parts 1 and 2, we’re going to tackle a few things in this blog post:
- Joining our current data stream with another sheet of Survivor data
- Pivot the data to alter the format of challenge wins
- Aggregate challenge wins by competitor across seasons
- Output the data to Tableau Server
I’ll also cover off on some other functionality that isn’t related to the above tasks in our walkthrough to make sure we hit all of the data transformation and output bases.
Data Joins
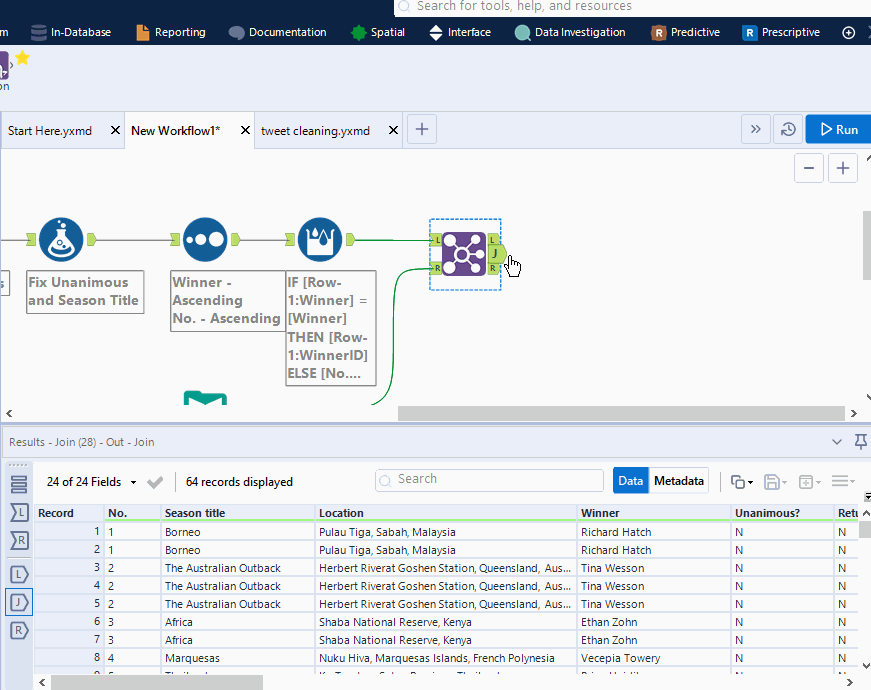
Remember how I said this excel file had multiple sheets with Survivor data? Time to bring in another sheet and join it with the one we’ve been working on. We are going to join on our new WinnerID field to get the challenge data from each of our winner’s appearances on the show.
Tableau Prep
Tableau Prep creates joins two different ways: below you’ll see I am dragging the new sheet on to the last step of our existing flow. I am choosing the Join option, but there is also option to Union the data.

Otherwise, you can create a join by adding a Join step and dragging the new sheet into the join.
Either way, in the configuration we will choose our join clauses, in this case PlayerID = WinnerID, and what type of Join we want, in this case inner. Prep will then show us how many fields we ended up with and anything that might be mismatched.

Alteryx Designer
Alteryx has several different join tools, for this I will just use the classic Join tool. I’ll place it on my canvas and drag the two flows into the L (left) and R (right) input anchors.

The Join tool configuration allows me to set the fields I’d like to join on. It also has the Select tool’s functionality for selecting fields, changing data types, or renaming.

This tool has 3 output anchors:
- L: any unmatched rows from the L input anchor.
- J: all joined fields
- R: any unmatched rows from the R input anchor
In this case there are no mismatched rows. I blame our outstanding data prep skills.
You may have noticed that I never chose which kind of join I wanted. That is because, by default, the Join tool alone will only give you an inner join. To do any other kind of join, you’ll need to add a Union tool and union in any applicable output anchor.

In this photo, for example, I’m showing an Left Outer Join.
Other Alteryx Join tools to be aware of: Join Multiple Tool

Join Multiple is similar to join but can join many data streams together. This tool results in a Full Outer Join.
As with most of these sections, Alteryx has an entire toolkit of Join options. This includes Fuzzy Matching, Find and Replace, Making Groups, and Appending Fields, just to name a few. Check out the entire tool category here.
Data Transformation: Pivots
Note: I’m about to transpose this data, despite it already being in the format I would want for Tableau. This is for demonstration purposes of the functionality only. This is not best practice for formatting data going into Tableau or other data and analytics tools. To learn more about structuring data for reporting tools, I recommend checking out Alex’s whitepaper on Creating a Reporting Data Mart.
The sheet we just joined in has data on Survivor challenge wins: Individual wins, Team wins, Total team challenges participated, and total individual challenges participated (including reward challenges, in case you were wondering). For example, here is what a row looks like below:
Player | Season | Indiv Win | Team Win | Total Team | Total Indiv |
|---|---|---|---|---|---|
Tyson Apostol | Blood vs. Water | 2 | 7 | 7 | 9 |
After the transpose, it will look like this:
Player | Season | Type | Value |
|---|---|---|---|
Tyson Apostol | Blood vs. Water | Individual Wins | 2 |
Tyson Apostol | Blood vs. Water | Individual Total | 9 |
Tyson Apostol | Blood vs. Water | Team Wins | 7 |
Tyson Apostol | Blood vs. Water | Team Total | 7 |
Tableau Prep
For Tableau Prep, I will use a Pivot step.

I will configure my Pivot to “Columns to Rows”. I can then drag and drop the fields that I would like to be pivoted. Tableau then shows you your pivot names and the values. I could also add an additional pivot, if I wanted to have a column for “Total” vs “Wins” and the pivoted named for individual vs team.
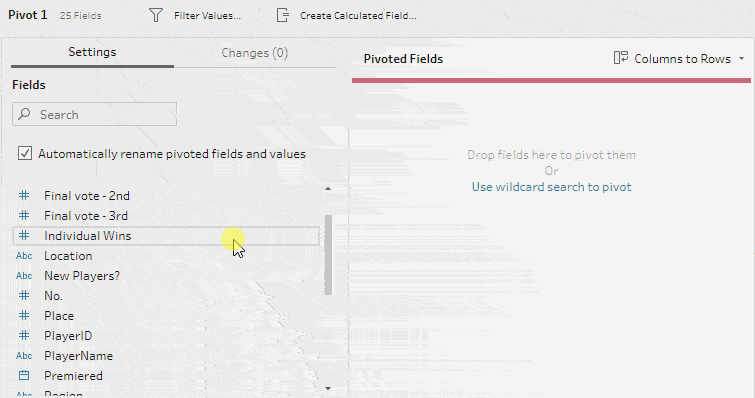
The pivot’s results are shown in the same configuration window, right next to the pivoted fields.

Alteryx Designer
In Alteryx, we will use the “Transpose” tool.

When I configure my Transpose tool, I’ll select all columns but the challenge data columns as my “Key Columns”. My data columns are the ones that we did not select for key.

The result gives us two fields: Name, which contains the old name of the column, and Value, which has the previous values of those columns.

Other Alteryx Transform tools to be aware of: Crosstab Tool

This is basically Transpose but reversed. If I wanted to undo the horrible damage I just did to my data, I would configure the Crosstab tool to group by all of the values that aren’t our two new fields, make Name our column headers, and Value our data element.
You guessed it: Alteryx has an entire toolkit of Transformation options. Explore the entire tool category here.
Aggregate Challenge Wins
Here, I am going to take the challenge data we just pivoted and aggregate it to the sum of all challenge wins across the competitor’s seasons appeared on.
Tableau Prep
Tableau Prep will use an Aggregate step to do this.

To configure the tool, I’ll drag and drop the options from the “Additional Fields” column to either “Grouped Fields” or “Aggregated Fields”, depending on what I want to do with them.

Alteryx Designer
For aggregation, I’m going to go to the Summarize tool.

This is very simple to configure and pretty similar to Prep. I’m going to select the columns from the top and use the “Add” button to decide how to the column should be handled. In this case I want the Sum of our value column (with the challenge win numbers) grouped by the type of challenge (Name) and the winner.

This options for summarizing aren’t just limited to string or number data formats: you can also use some great summarizing features with both the Spatial and Reporting tools in Alteryx.
Data Output
Now our data is all dressed up with nowhere to go! Let’s figure out where and how this data is going to output.
Note: At this point in writing the blog post, I closed my laptop for the day to continue the next day. Had a cup of tea, watched Survivor (another of my favorites was voted out; I’m very upset), and slept soundly without realizing I forgot to save either program’s workflow and my computer errored and shut down… so did anyone AUTOSAVE? Alteryx certainly did- zero progress lost. Tableau Prep on the other hand, didn’t…. so I have to start over.
Tableau Prep
Before the walkthrough, let’s talk possibilities for output with Tableau Prep:
- Publish to Tableau Server
- Output as .csv, .tde, or .hyper
Either of the options you’re using from above, we use an Output step. Below is the radio button showing configuration for publishing to a file. We’ll want to change the radiobutton the Publish as a data source – this is the option for publishing to Tableau Server.

When you select the “Publish as data source” option, you are prompted to sign in to Tableau Server. Below is the configuration once signed in. Select the project, name it, give it a description, and you’re good to go.

Alteryx Designer
Again, let’s start with our options:
- Publish to Tableau Server
- Publish to PowerBI
- Output as .tde or .hyper
- Output as .csv, .txt, — basically any flat file.
- Output to multiple files in one tool
- Database write back
- Check out all of your options here. It’s so many, I cannot write them here.
In most cases for output you will use the standard Output tool; that will cover most of what you see above. In this case, we’re publishing out to Tableau Server, so I’ll use the Publish to Tableau Server tool. This tool used to be a macro available on Alteryx Gallery but now comes with Alteryx upon install.

To use the tool, you need to sign in to Tableau Server in the configuration tab. Once you type in your server creds and connection details, you can save it for easy access later, like I have with my Tableau Online account as seen below.

Once signed in, configure the workflow to publish to the project of your choosing and whether it overwrites, appends, or creates a new data source on Tableau Server.
Conclusions
We just covered a lot of ground. Let’s talk takeaways.
Tableau Prep
Tableau Prep has made it pretty easy for us all around, but there are a few pivotal (no pun intended) elements that it is missing.
Tableau Prep Pros:
- Join tool allows for selecting join type in one simple configuration
- Add multiple pivots on one step
- Easy aggregating and summarizing
- Easy output to Tableau Server
Tableau Prep Cons:
- No autosave.
- Data Results viewers are cramped and difficult to navigate. This may be personal preference, but I notably dislike the user experience for viewing my resulting data in both Aggregate and Pivot steps.
- Only real option to output data to Tableau Server. No database write back. The admin in me is screaming Tableau Server is not a database!!!!
Alteryx Designer
Again, Alteryx hits us with significant depth of functionality.
Alteryx Designer Pros:
- Many options for how to join your data, such as funny match, appending values, or find and replace
- Easy aggregating and summarizing
- Easy output to Tableau Server
- Output to many different sources, including database write back
- Autosave on run!
Alteryx Designer Cons:
- Crosstab/Transpose may not be as immediately user-friendly as prep’s configuration.
- Output anywhere, enabling use of reporting data marts before pushing into Tableau Server or another reporting tool.
I cannot overemphasize the limitations I feel from the output options Tableau Prep currently has. I hope this is an area they plan to improve as I firmly believe Tableau Server works best when working with a reporting data mart layer.
This was the last part of our key components to data prep. In part 4, I will be digging deeper into other features we may have missed and some of the costs associated with each of the platforms.
What do you think of the two tools so far? Do you have more questions about Tableau or Alteryx? Talk to our expert consultants today and have all your questions answered!


