Every now and then, a client will ask if it’s possible to use Power BI to compare values using two manually adjustable date ranges. The answer is of course, yes. However, the steps to get there involve a couple of tricks that may not be so obvious.
All you need to make this happen are two identical date tables and the measure you’d like to compare against itself using the two date ranges.
In this blog, I’ll give step-by-step directions for comparing a value with two date ranges that your users can adjust manually, using an example from a public sales dataset.
What Do We Mean by Using Two Adjustable Date Ranges?
This question is best answered with an example. Suppose your manager wants to see sales for Q1 of 2022 compared to Q4 of 2021; an even more complex request would be to view sales for February and March of 2022 against August of 2020.
I honestly don’t know why the second example would ever come into play, but the point is that using the technique described in this blog, your users will be able to manually select a date range for a value and then compare that same value against a different date range that is also selected.
How to Compare a Value with Two Adjustable Date Ranges
The example below shows how to compare Total Sales for a given date using a primary calendar table with a baseline date range from a separate calendar table.
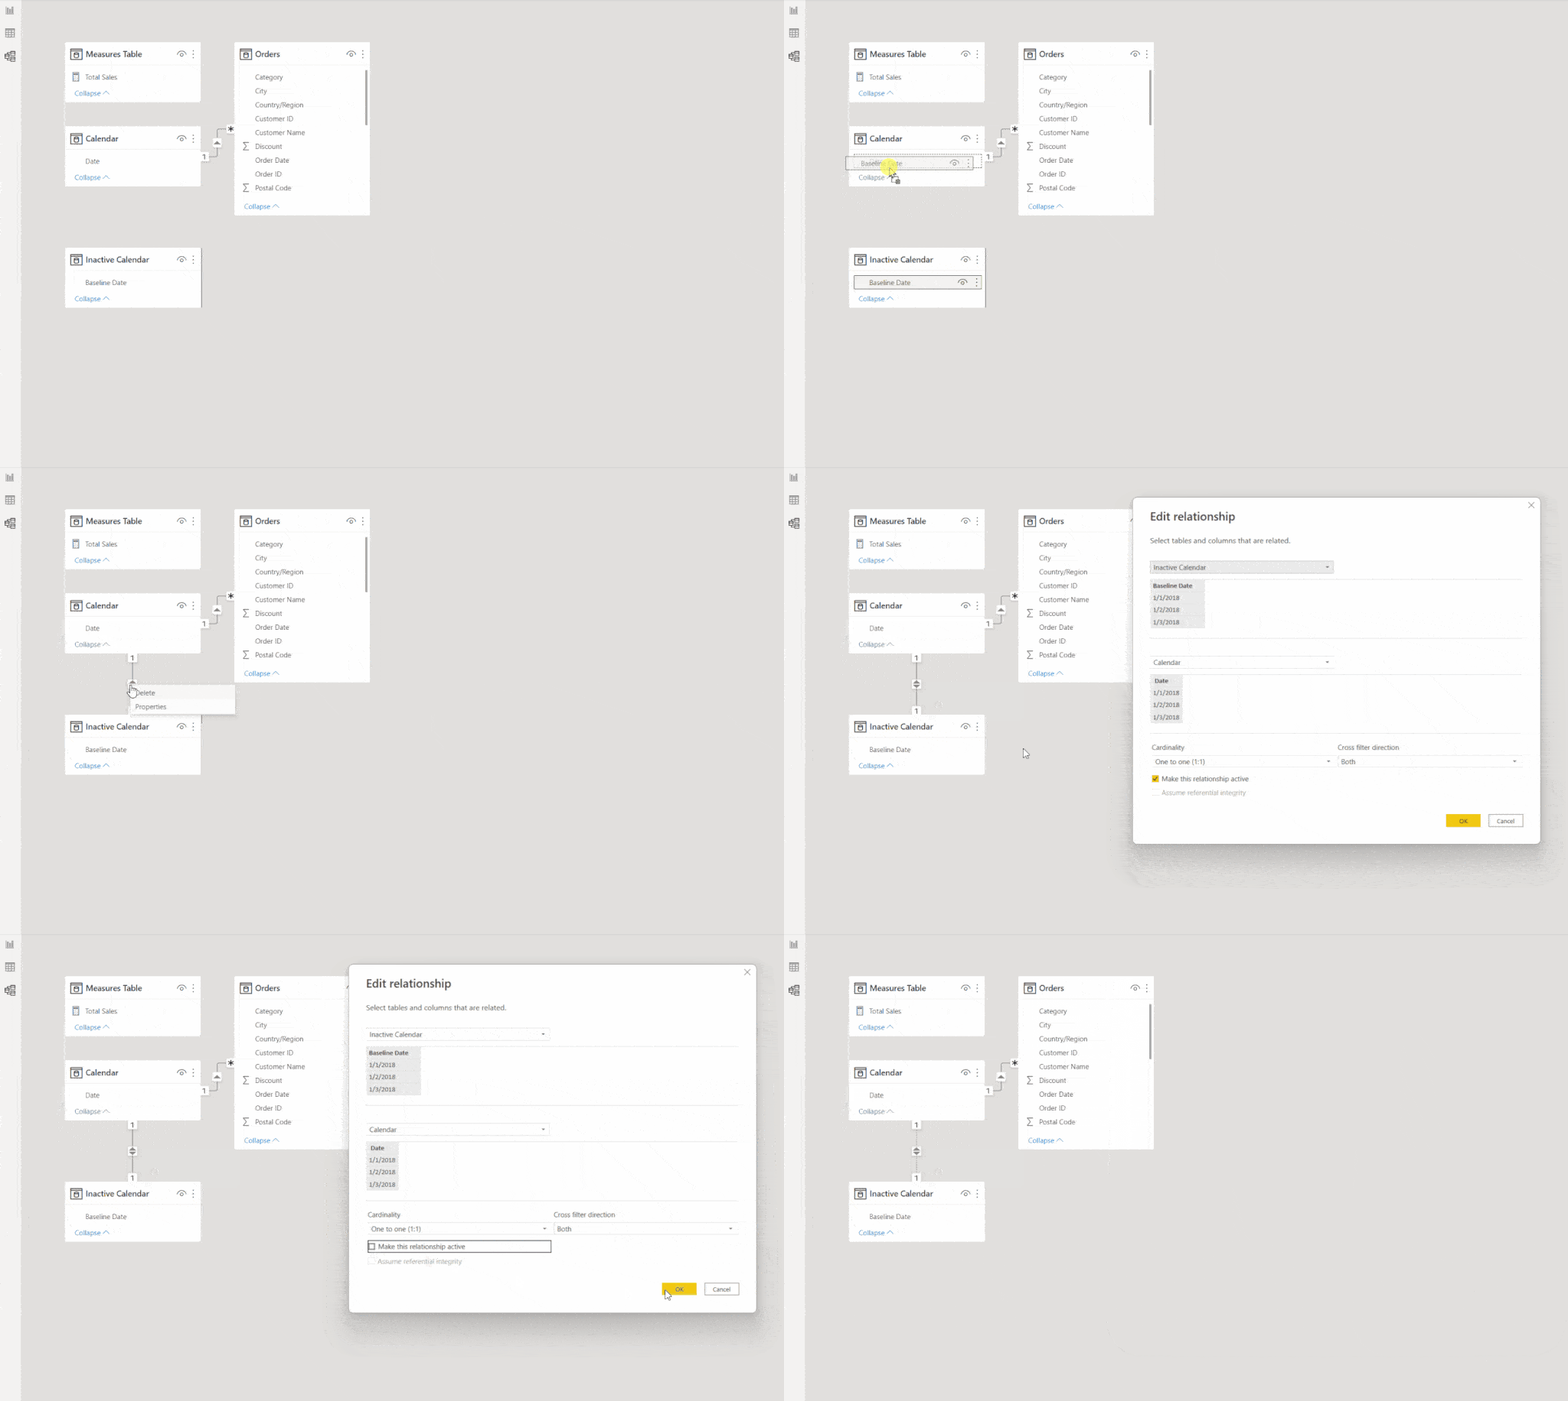
Before we get started, let’s take a look at the model. The screenshot below shows a simple Orders fact table with a Calendar dimension table and a measures table – learn how to create a separate measures table here.

Now that we have are starting place, let’s build out this use case step-by-step.
Step 1: Create an Inactive Calendar Dimension Table
- Open Power Query by clicking the Transform Data button on the top ribbon
- Right-click on the Calendar table in the panel on the right and click Duplicate
- Rename the new calendar table to “Inactive Calendar” and the Date column to “Baseline Date”
- Click Close & Apply on the top left
- Create the inactive relationship between the two calendar tables – see video below

Step 2: Create a Baseline Measure for Total Sales
This is the measure you will use with a date range from the Inactive Calendar table.
- From the report view and with the Measure Table selected, click New Measure on the top ribbon.
- Add a measure called Baseline Total Sales with the following formula:
Baseline Total Sales = CALCULATE('Measures Table'[Total Sales],ALL('Calendar'),USERELATIONSHIP('Calendar'[Date],'Inactive Calendar'[Baseline Date]))
Step 3: Add Two Date Slider Visuals
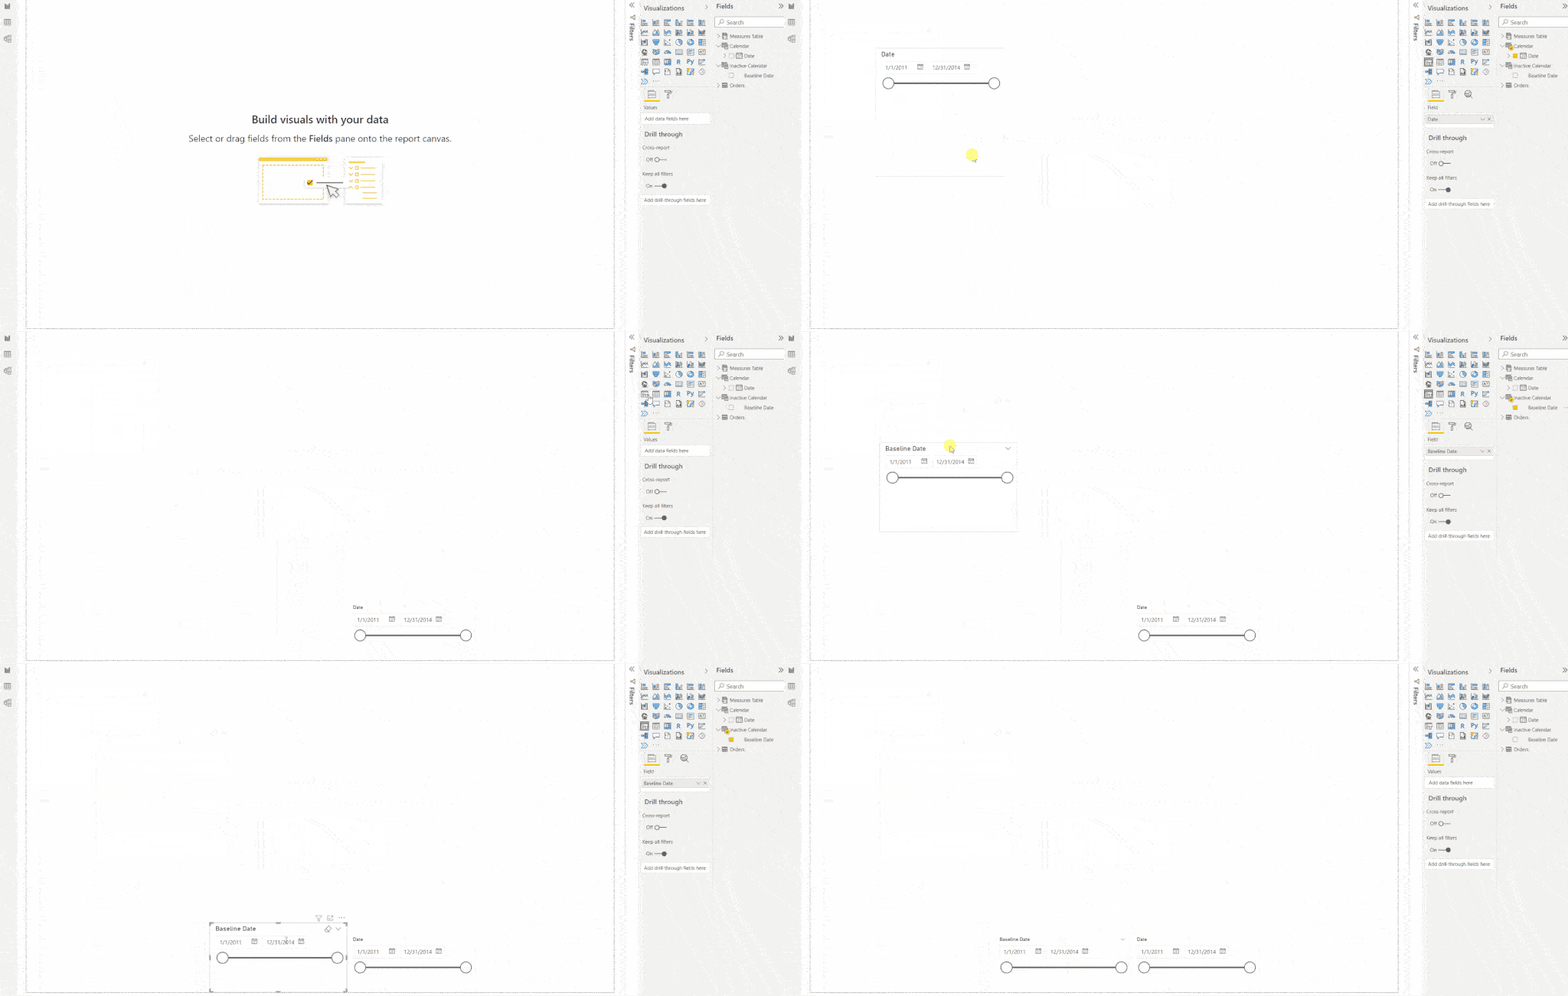
One date range slider will be from the Calendar table, and the other will be from the Inactive Calendar table – see video below. These sliders will allow your users to manually adjust the baseline date range and the primary date range.

Step 4: Add a Visual with Baseline Total Sales and Total Sales to the Canvas
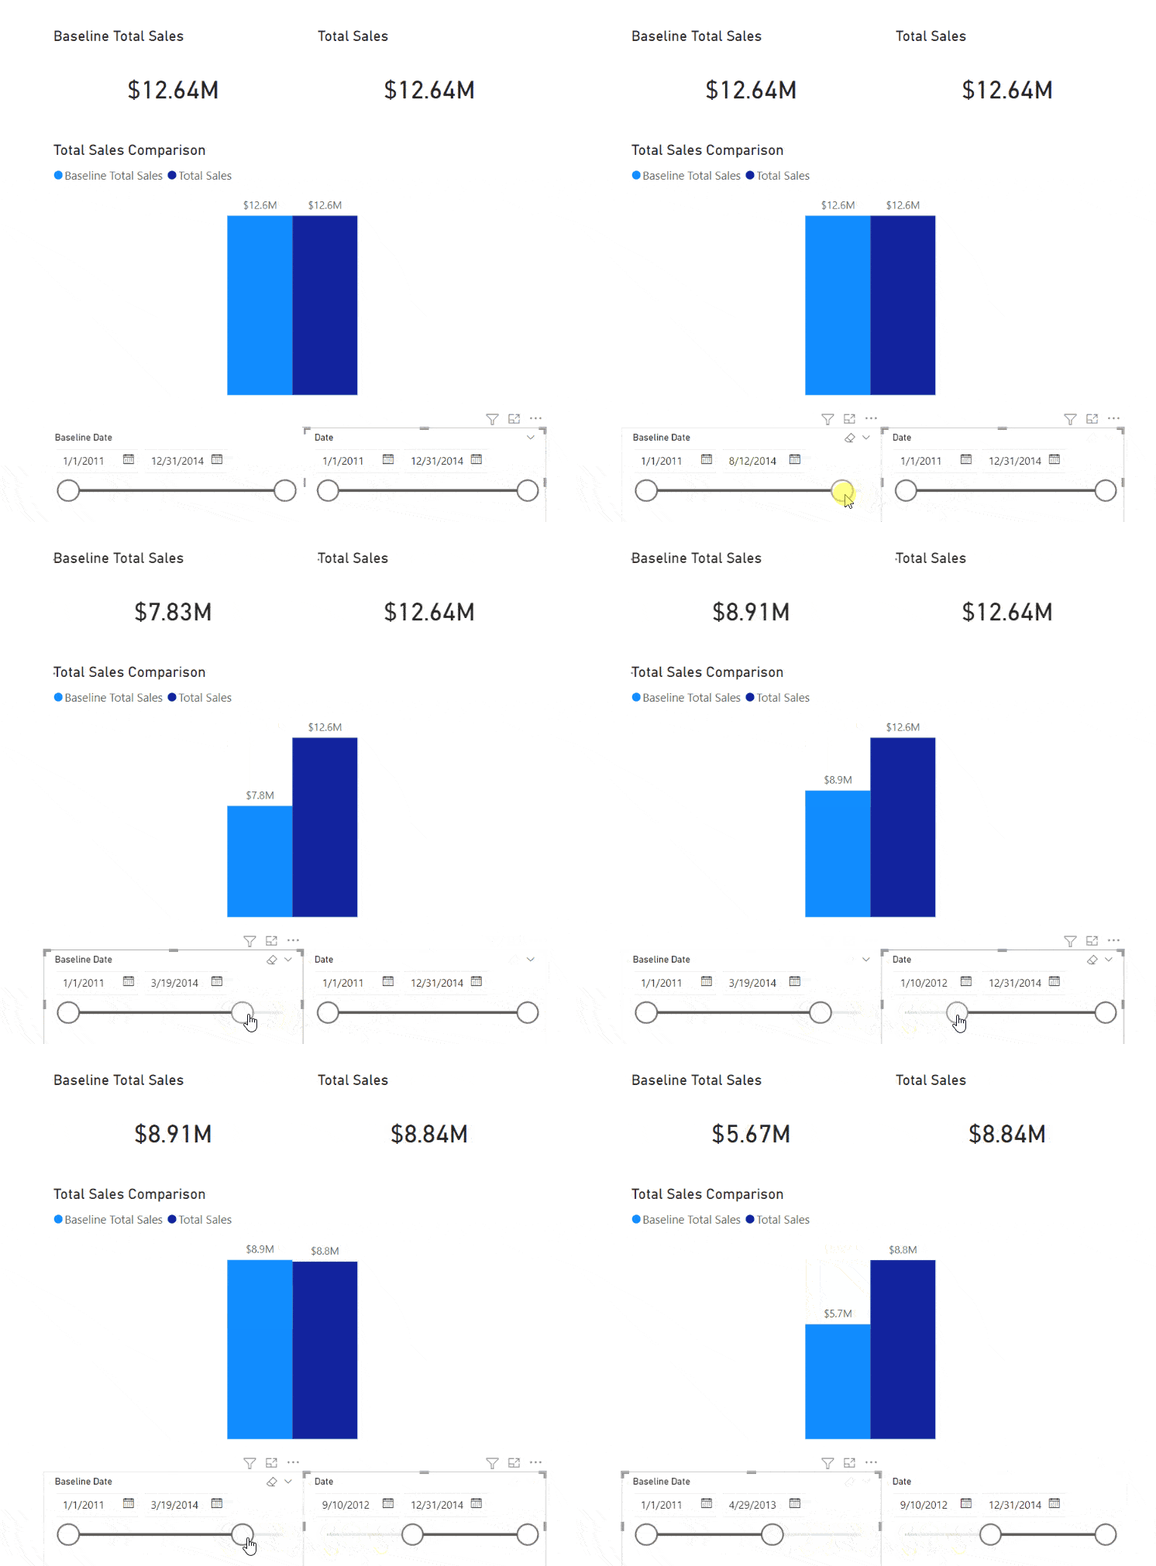
The gif below uses one card visual for each of the measures and a clustered column chart with both measures side by side.
Step 5: Use the Sliders to Adjust the Date Ranges for Each Value
Verify that the values in the visual are changing appropriately with each date range slider.

Closing
Giving your users the ability to compare a measure using one date range against itself from a different date range is a level of report customization well within the capabilities of Power BI. Using this technique will allow you to create a dashboard for your users where insights can be driven by comparing values with multiple customizable data ranges for any of the KPIs important to your business.
Do more with your organization’s data by implementing a dashboard such as this one. Reach out to our team of Power BI experts today!
FAQs
Yes. Use the same Inactive Calendar table with the DAX used above for the Baseline Total Sales, except switch Orders for Sales (or any other measure you want to compare).
Yes. You will need a 3rd date table that has the same relationship as the Inactive Calendar table created above, as well as another measure following the same syntax as the Baseline Total Sales measure that uses the 3rd date table.


