

Have you ever experienced the frustration of creating a well-formatted summary table in Tableau only to have some cells show up as blank? You may have tried using the ZN function or Lookup with ZN but found that they only partially addressed the issue or created new problems.
You just get so frustrated that you wish you could just manually fill the zeros like in a normal spreadsheet. If this sounds like a familiar scenario, you have landed on the right page.
In this blog, you will understand why nulls/blank values come up in your Tableau tables and also learn effective methods for replacing them with zeros in various scenarios.
These scenarios range from simple cases, like when raw data contains null values or missing records, to more complex cases, such as empty rows or columns resulting from filtered data or the pesky retention charts used for cohort analysis.
Dataset
You can use the latest (2019-2023) superstore dataset to follow along and try the techniques for yourself with the following tweaks.
To get started, first add a data source filter (as shown below) just to keep the crosstab smaller.

Also, for emulating blank raw data, create a calculated field called “M Sales,” which returns the Sales if the Order ID ends with a “9” or else NULL.
					//M Sales
IF RIGHT([Order ID],1) = "9"
THEN [Sales]
ELSE NULL
END

Scenario 1: Null Value in the Raw Data
Issue
You will encounter this scenario whenever there is a record (row) in the underlying data, but the measure is blank. The M Sales is an example of this.
If you want to see how this will affect a view, create a crosstab using Months of the Order Date field on Rows, Sub-Category on Columns, and M Sales as the Measure on the Text tab of the Marks card, as shown below.

There are a few blanks in the table, but notice the value highlighted in the bottom-left corner. It says 108 marks. This crosstab also has 108 cells (12 rows x 9 columns). In other words, you are in this scenario when there are enough marks to fill all the cells, yet there are blank values in your crosstab.
Fix
You must wrap the SUM(M Sales) in a ZN to fix this problem. The ZN function will return the expression if it is Non-Null; otherwise, zero.
Create the following calculation and place it on the text to do this.
					// M Sales w/ ZN
ZN(SUM([M Sales]))
Alternatively, you can replace the measure with the above calculation in the shelf, as in the image below.

The blank values that were present previously are now filled with zeros.
Scenario 2: Few Missing Records in the Raw Data
Issue
Sometimes you will encounter scenarios with no rows in raw data corresponding to the specific combination of dimensions added to the view.
You can try this by adding a Ship Mode = Same Day filter in a duplicate of the previous sheet, as shown below.

There are only 84 marks (as against the 108 marks in the previous scenario) now and that is exactly why there are blanks even though the measure is wrapped in ZN.
Fix
To fix this, you can go to the Top Menu, select Analysis >> Table Layout, and then select “Show Empty Columns” and “Show Empty Rows.”
Your result will be the following:

This fix gets you back to 108 marks, as Tableau is now forced to show the empty columns and rows. Doing this lets ZN do its magic; you will have zeros instead of blanks.
Scenario 3: Many Missing Records in the Raw/Filtered Data (Empty Rows/Columns Not Needed)
Issue
The quick fix in the last scenario works in most situations, but sometimes if the filters you have applied filter out entire columns or rows, Show Empty Rows/Columns will show these as completely blank in your view.
To try this out, duplicate the previous sheet and add Year of Order Date = 2020 and Segment = Corporate in the filters.

There are just 48 marks with four blank rows and three blank columns!
This issue happens because, for Show Empty Rows/Columns to do the thing it did in the previous scenario, you need at least one entry in that row/column.
Fix
Since the empty columns/rows are not needed in the view, you can start by unchecking Show Empty Columns and Show Empty Rows from Analysis >> Table Layout.
Below is what you should get after removing the checks for both:

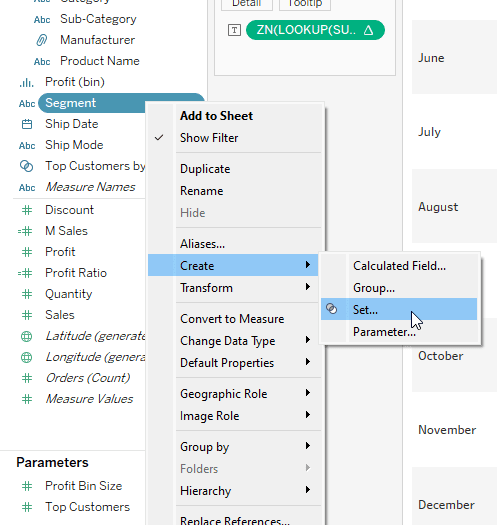
You need at least 30 marks (5 rows x 6 columns) for ZN to work, but there are only nine marks now. To solve this, you need to get the lookup of the measured value at the 0th position and wrap that in ZN.
Create the following calculation and place it on the text to do this:
					//  M Sales w/ ZN and LOOKUP
ZN(LOOKUP(SUM([M Sales]),0))
Alternatively, you can replace the measure with the above calculation in the shelf, as in the image below.

In a Lookup of the 0th position, Tableau will return the value present in a cell in that cell. Consider this as making Tableau report back the values it added to the crosstab. If it is blank for any reason, Lookup will report back Null (which is why there are 30 marks now), thus letting ZN do its thing.
Scenario 4: Many Missing Records in the Raw/Filtered Data (Empty Rows/Columns are Needed with Zeros)
Issue
Sometimes you will have situations in which your end-users want to see the empty rows/columns with zeros instead of them being removed from the view. Moreover, they might want to try different filter combinations.
You can try out different combinations of filters to see what happens.

Changing the Year from 2020 to 2021 gets you down to 12 marks from 30. Yikes!

Keeping the Year 2021 and changing the Segment to Corporate gets you up to 90 marks!
You must have also noticed that your table layout (number of rows and columns) changes dramatically when you play with the filters. This change might not be acceptable to your end-users.
So, what will you do if you want to give your end-users the freedom to go crazy with the filters AND want to preserve the layout AND fill the resulting empty columns/rows with zeros?
Scroll down.
Fix
To fix this, first, you must determine which filters can be hardcoded and which need to be dynamic. Assume that the Ship Mode = Same Day is hardcoded (imagine you are building a crosstab for Same Day shipping), and you want your users to use Segment and Year filters freely.
Create two sets, one for each of the two dynamic filters you want.
You must create a custom date with just years to create the Year Set.

It does not matter if you choose Date Part or Date Value if the Detail is Years.
Then use this to create the set.

Now, you may be wondering why you have two sets for the filters you want. This is because a “Show Set” UI is exactly the same as the filter and it will act as the “filter” going forward.


Create a new calculation with a very original name like “M Sales 2” as shown below.
					// M Sales 2
INT(
[Ship Mode]="Same Day" AND [Order Date (Years) Set] AND [Segment Set]
)*[M Sales]
Adding a set in a calculation returns TRUE when the value is in the set, and INT(Boolean) returns 1 for True and 0 for False. Thus, M Sales 2 will return the M Sales when the three conditions are met and a zero when they are not.
Since the M Sales has blank values, create a new calculation by wrapping it in ZN and place that on the text.
					// M Sales 2 w/ ZN
ZN(SUM([M Sales 2]))
Alternatively, you can replace the measure with the above calculation in the shelf like in the previous fixes.
Once the new measure is in the view, remove all three filters, and show (the show set option will be grayed out unless the measure is in the view) the two sets.
This will be the result you end up with after doing that.

For the earlier filter combination of Ship Mode = Same Day, Year of Order Date = 2021, and Segment = Corporate, notice that we have 108 marks instead of just 12!

Even if you do not select anything in the “filters,” there are still 108 marks, thus allowing ZN to do what it is supposed to, and you get zeros everywhere!
Note: You can hardcode all your filters like the Ship Mode if your end-users do not need to filter. Similarly, you can create sets for all the filters you need if end-users want to filter everything. In certain cases, when a date field is used as a filter, it might be better to replace that with parameters (as you will get a better UI for date fields) instead of sets and use that condition inside the INT.
Scenario 5: Blanks in a Retention Chart Used for Cohort Analysis
Issue
A retention chart is one of the most powerful tools used in cohort analysis. If you have used this chart before, you might have encountered the problem with nulls.
You only need to create two calculated fields to prepare a retention chart. The first is a calculated field called “Quarter First,” which returns the quarter in which a customer placed their first order. Set the default format for this to something more straightforward like: yyyy – “Q”q.
					// Quarter First
{ FIXED [Customer Name]: MIN(DATETRUNC(“quarter”,[Order Date]))}
Next, create a calculation called “Quarter Diff” as follows. Convert this to dimension so it doesn’t aggregate when you add it to the view.
					// Quarter Diff
DATEDIFF(“quarter”,[Quarter First],[Order Date])
You can prepare the retention chart by dragging Quarter First in Rows, Quarter Diff in Columns, and using Customer Name aggregated as Count (Distinct) in the text. Additionally, also add Segment = Home Office in Filters just so that there are more blanks to work within the chart.

Since there are just 117 marks (as against 136 needed), vanilla ZN will not work. Also, Lookup+ZN will consider this as a normal table and fill all blanks (even the ones in the bottom half of the triangle) with zeros.
Try it out.
Fix
The key lies in identifying the diagonal values and using them as a border for filling blanks with zeros.
To achieve this, make two calculations called “Max Quarter Row” and “Max Quarter Column.”
					// Max Quarter Row
WINDOW_MAX(MAX(DATEDIFF(“quarter”,[Quarter First],{MAX([Order Date])})))
{MAX([Order Date])} returns the maximum order date in the data. The DATEDIFF part will return the difference between the quarter when the first order was placed and the maximum order date. Wrapping the entire thing inside a WINDOW_MAX(MAX()) ensures that the value is available in all the cells of a given row.
You can see what this returns by removing the measure and adding this calculation (with “Compute Using” set to Table(across)) in the text.

This calculation gives you the maximum Quarter Diff possible for each Quarter First. Thus, the Quarter Diff value that matches this value is the diagonal value for that Quarter First.
Next, create the calculation to get the Quarter Diff in each cell as follows.
					// Max Quarter Column
WINDOW_MAX(MAX([Quarter Diff]))
If you add that in the view (with “Compute Using” set to Table(Down)), you will end up with the following.

With this, you have everything you need to get the diagonal value.
Create a calculation that will act as the new measure and give it a very original name like “COUNTD Customer Name 2”.
					// COUNTD Customer Name 2
IF [Max Quarter Column] <= [Max Quarter Row]
THEN ZN(COUNTD([Customer Name]))
END
This is what you should get if you add it to the view.

It works exactly as expected. It is so robust that even if you manually exclude all but one value from a row, you will still get zeros instead of blanks in that row. Try it out.
Note: If something looks weird, check if the “Nested Calculations” of Max Quarter Row and Max Quarter Column inside COUNTD Customer Name 2 are computing along the directions shown earlier.
Conclusion
Hopefully, you know how to fill the nulls/blanks in your tables with zeros, even in some of the most demanding situations. No matter the scenario, the key idea is to have the same number of marks as there are cells and then let ZN do its thing. Use the techniques from this blog and develop unique solutions to handle the curve balls thrown your way!
If you want more information about nulls/ blank values in Tableau, contact our team of experts!


