What is Batch Data?
Organizations produce, consume, and store large amounts of data. Batch data is extracted once or in batches (for instance hourly or daily). It is then transformed, stored, and made available in a data environment that can be consumed by Business Intelligence (BI) tools like Power BI or by Analysts who can run queries against the database. Azure is a Microsoft tool that provides a suite of services that make data engineering deployments fast and easy.
Azure Data Architecture

Overview
In this blog post, I am going to run through a scenario where we extract batch data using an API and store it in Azure. Then we are going to take that data and create a Power BI visualization in Power BI Desktop. See the steps below:
- Source data: CryptoCompare Daily Par OHLCV (Open, High, Low, Close, Volume From and Volume To) API for historical Bitcoin (BTC) prices in USD. FSYM is the cryptocurrency code, TSYM is the desired currency, and Limit is the number of records to extract from the API
- Batch processing: Azure Data Factory. Use Azure Data Factory to call that API service and land data into Azure Data Lake Storage as a parquet file (special file format that is useful for importing into Azure Synapse Analytics)
- Storage: Azure Data Lake Storage
- SQL: Azure Synapse Analytics
- Visualization: Power BI. Visualize historical data in Power BI and publish a dashboard
NOTE: We’re using native Azure tools that source data for batch processing. Use Azure Data Factory REST resource to call the API and get the daily statistics.
What about the Data?
The API output is a nested JSON structure where the data component has an array with key value pairs for each historical event. The time value sent is an epoch time and will need to be converted for a better end user experience.

You’ve got to build out the infrastructure in Azure to support the architecture flow. We’re going to use Azure Synapse Analytics to create an external table that points directly into the parquet file in Azure Data Lake Storage. Azure Synapse Analytics has the ability to run as a serverless SQL engine which allows for rapid setup without the huge effort of setting up a SQL Server database because it is all done behind the scenes. This allows us to run queries and BI on top of Azure Data Lake.
Azure Synapse Analytics can be pretty expensive, so stay on top of your costs. You can monitor your spending using the Cost Analysis dashboard in the Azure Portal homepage.

Let's Get Started
If you’re new to Azure, you’ll need to set up a few resources before you can start:
- Subscription: this allows you to see your overview and current spend. Additionally, you can compare current and forecast costs in the Cost Analysis tab where you can also set up a budget.
- Resource Group: this is a logical grouping of resources. For an Enterprise these are typically broken out by department, line of business, or subject matter.
You’ll need to create a Storage Account and container (this is essentially folder within the storage account).

Create an Azure Data Factory Workspace
Next, you’ll need an Azure Data Factory workspace that will allow you to build a pipeline to host the Data Copy job. Skip the tab to Configure Git (this is for checking in our source code. You can use Azure DevOps (formerly Team Foundation Server) or Git. For this demo we don’t need either. In an Enterprise scenario, in order to productionize this, you will need to track all the commits and changes in Azure DevOps or GitHub. Take the default values for the other tabs or just click Review and Create.

You’ll use Azure Data Factory Studio to build pipelines within Azure Data Factory. A pipeline is a very powerful ETL tool. You’re going to use a Copy Data module to take the API data and load it into the Azure Storage Account as a parquet file. You can land it as a JSON, csv, and many other formats but parquet is structure-optimized for storage and consumption by Azure Synapse Analytics.
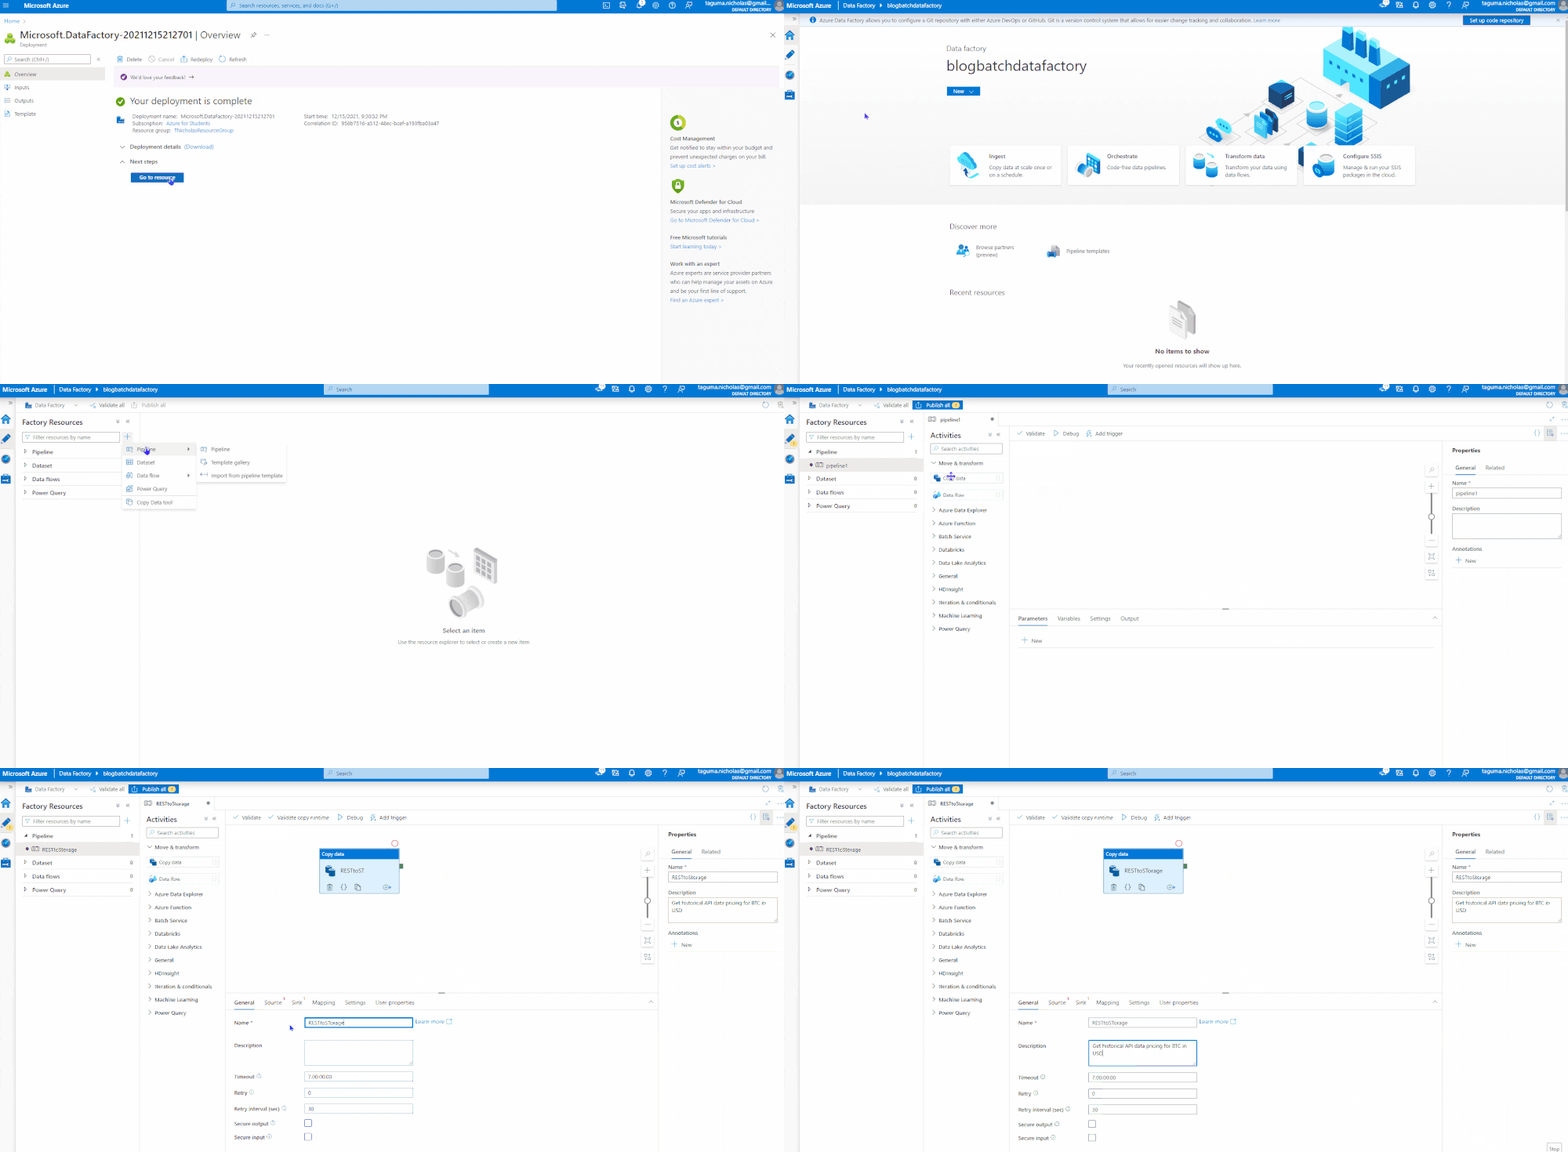
Note: ETL, which stands for extract transform, and load, is a data integration process that combines data from multiple data sources into a single, consistent data store that is loaded into a data warehouse or other target system.
Source the Data
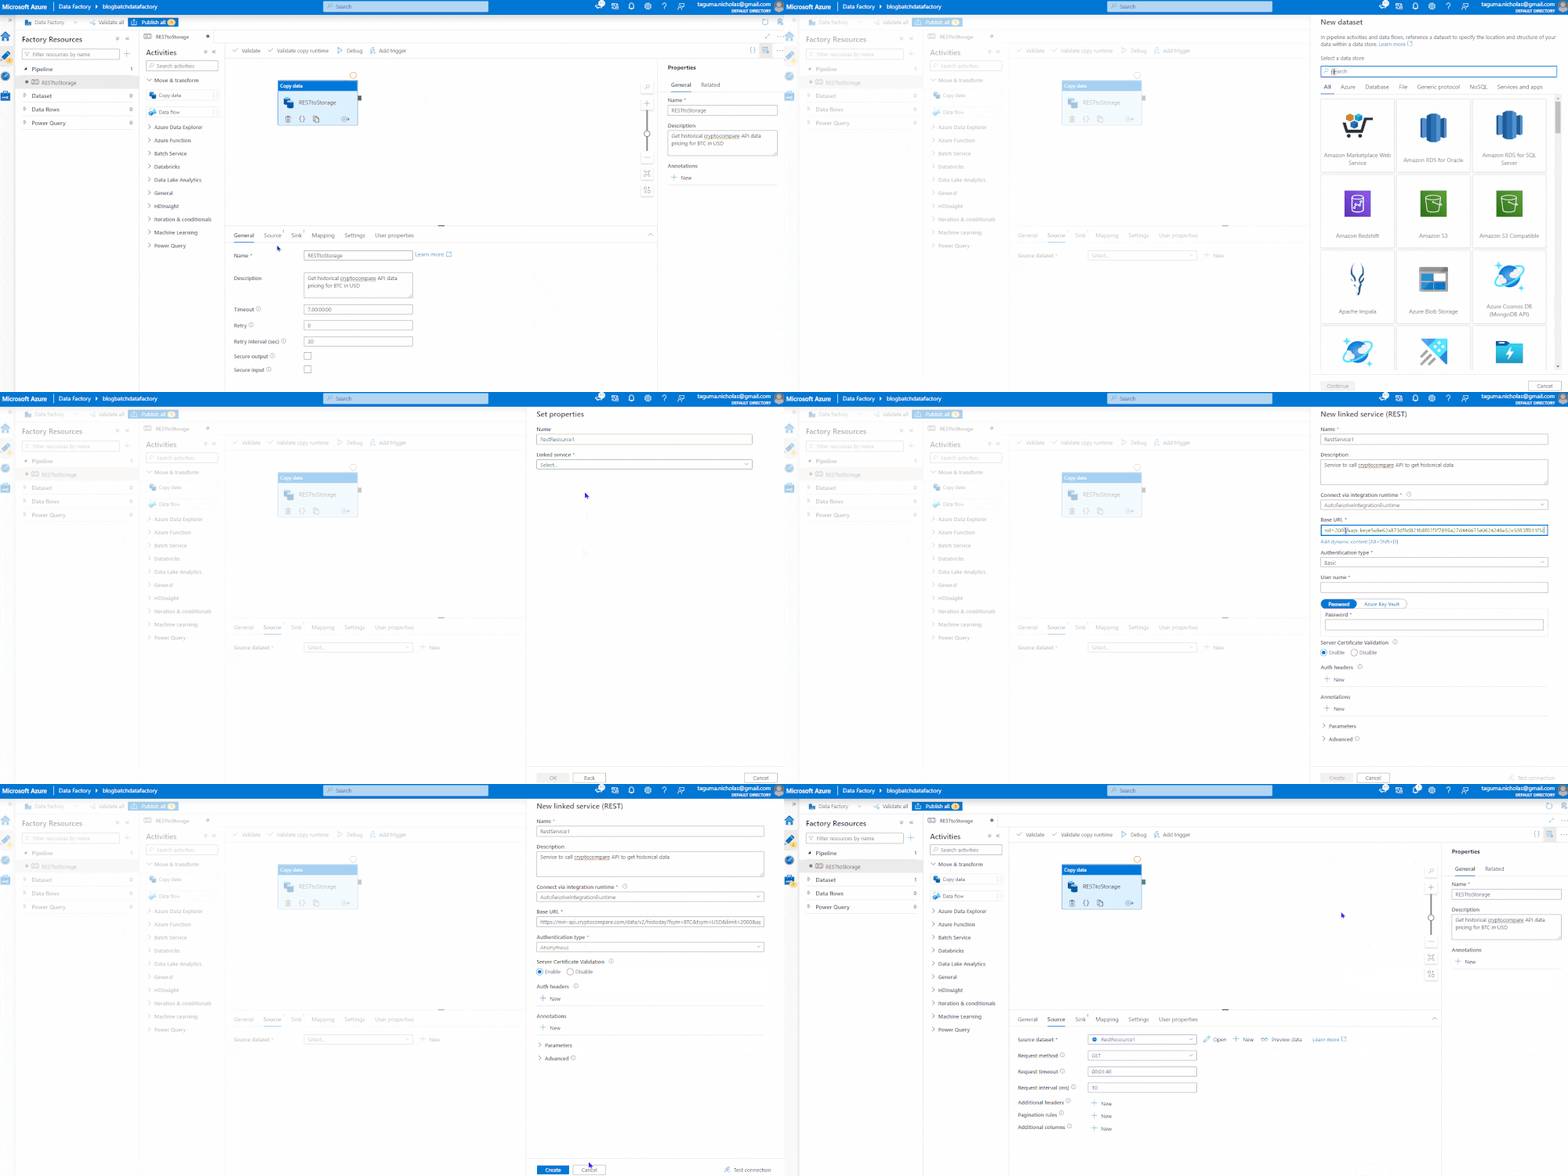
The Copy Data module will have a source and a sink. The source contains a linked service where you specify the connection strings. Use the CryptoCompare API endpoint for the base URL and set the authentication type to Anonymous since it has the key baked in. You can preview the data to ensure it is flowing.
Sink the Data
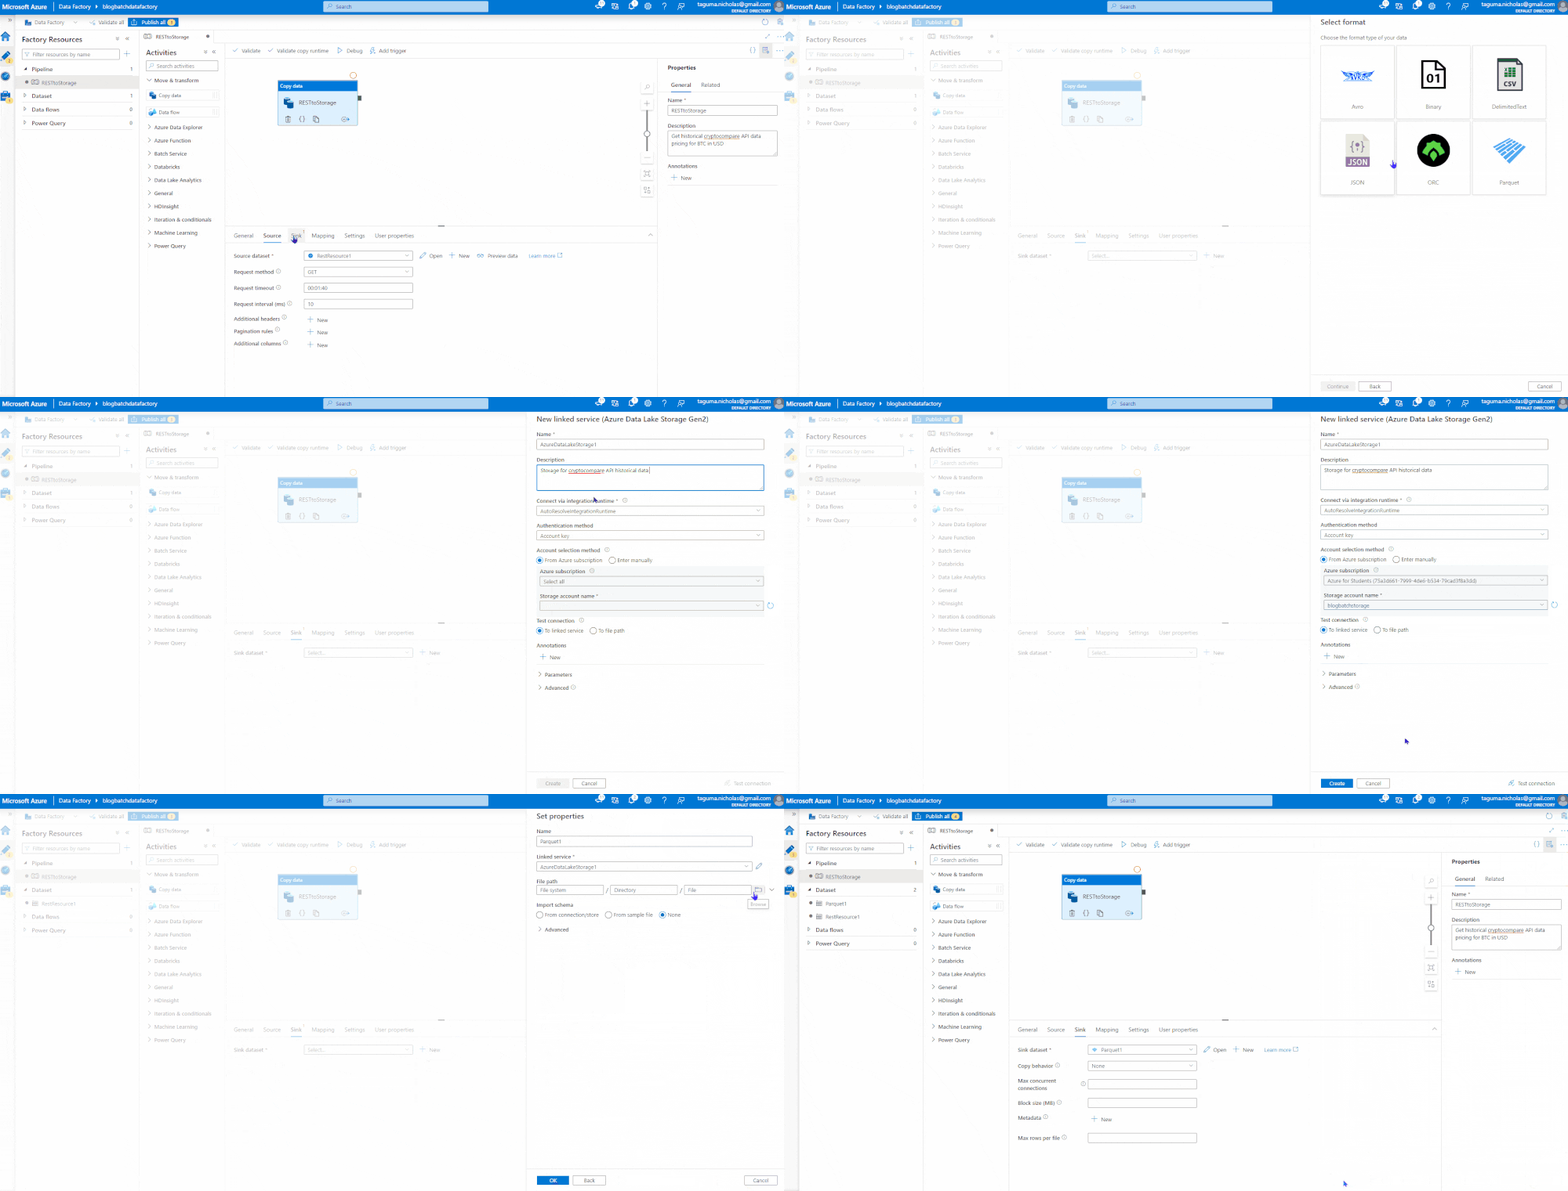
This is the target, which will be an Azure Data Lake Storage account where we plan to land the data as a parquet file. It is good practice to test your connections before you create.
Map the Data
Now that we have identified the source and target data sets, we need to map the data. First, you need to import the schema which selects the structure of the incoming JSON object. The JSON object contains some complexity that is not necessary for the parquet and can be deleted. You will need to set the data types then validate, debug, and publish. Validate checks that the code is correct, Debug runs the job, and Publish is like Save. If you’re connected to GitHub or Azure DevOps, it will check the code in (CTRL + S will also save it).
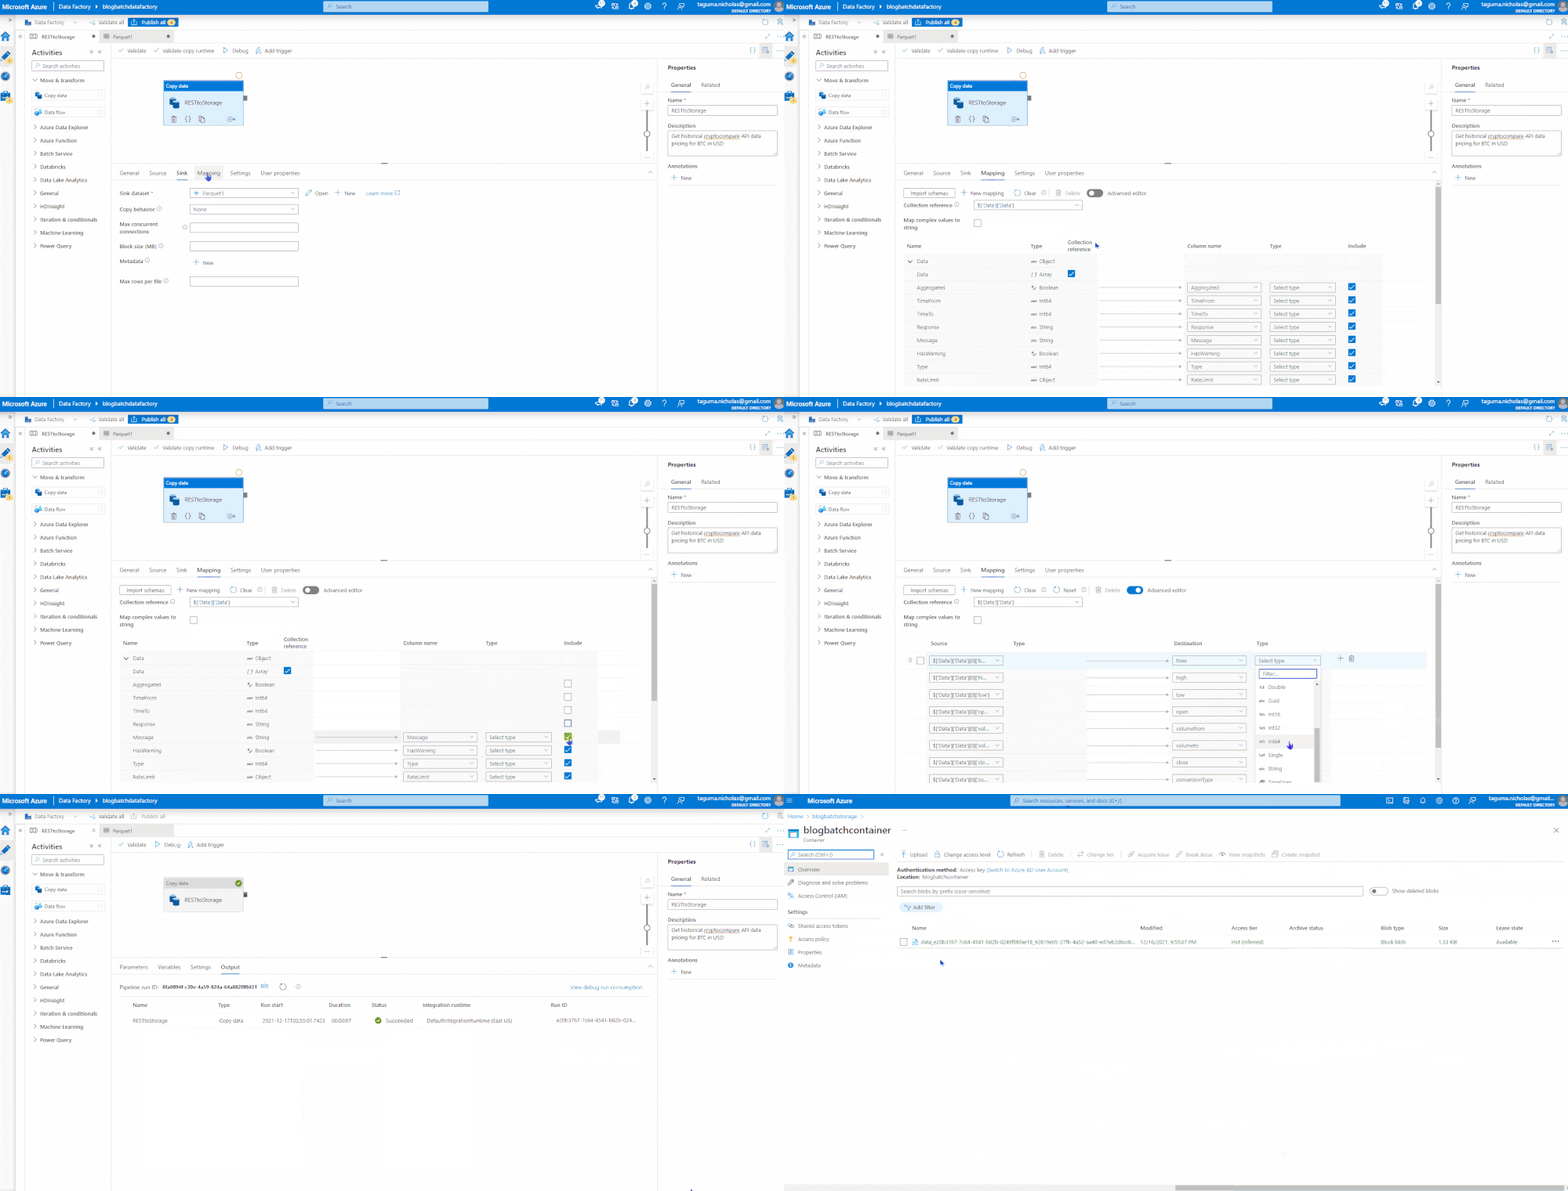
Pat yourself on the back! You’ve developed your first data factory pipeline with a copy data set that took a REST endpoint, coded the parameters, got the output, loaded and converted it into a parquet format, and saved into a storage account.
Create a SQL Server using Azure Synapse Analytics
Next, we’re going to spin up an Azure Synapse Analytics workspace. We’re creating a SQL server behind the scenes, so you need access credentials. In the network settings, I am allowing connections from all IP addresses, but when you are in a Production environment, you should restrict this for secure access.
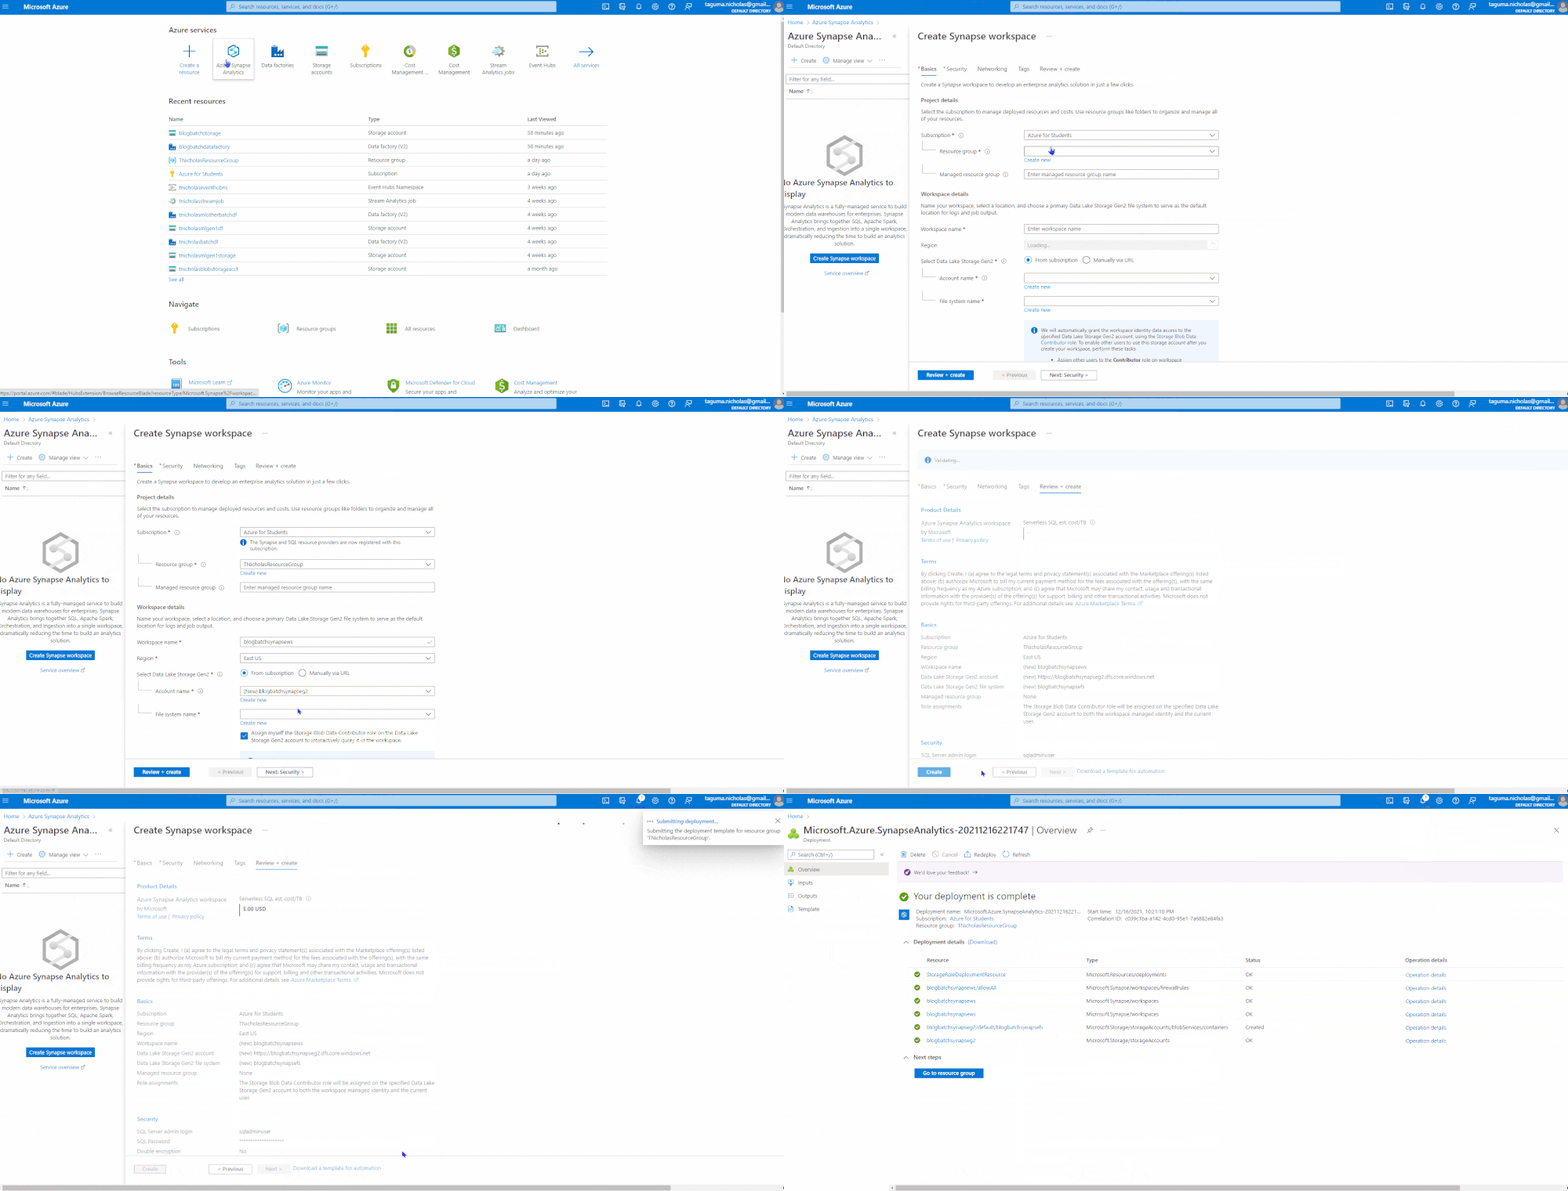
Create a Serverless SQL Pool in Azure Synapse Analytics
In order to create a dedicated SQL pool you have to create a whole new environment for SQL Server. Azure Synapse Analytics allows you to create Serverless SQL pools with a click of a button. There are limitations; in a Serverless environment you can’t create direct (physical) tables, only external tables. External tables link files in other systems, expose them to the SQL database, and enable you to query data in different formats. For this demo we’re going to use the parquet file to create a stored data set.
NOTE: You can also create Apache Spark pools which you can run different Machine Learning tools on top of as well.
Create an External Table
To create an external data set pointing to the parquet file, you’ll need to work through some permissions. In the Identity and Access Management settings, you will need to add yourself as a Storage Blob Data Owner.
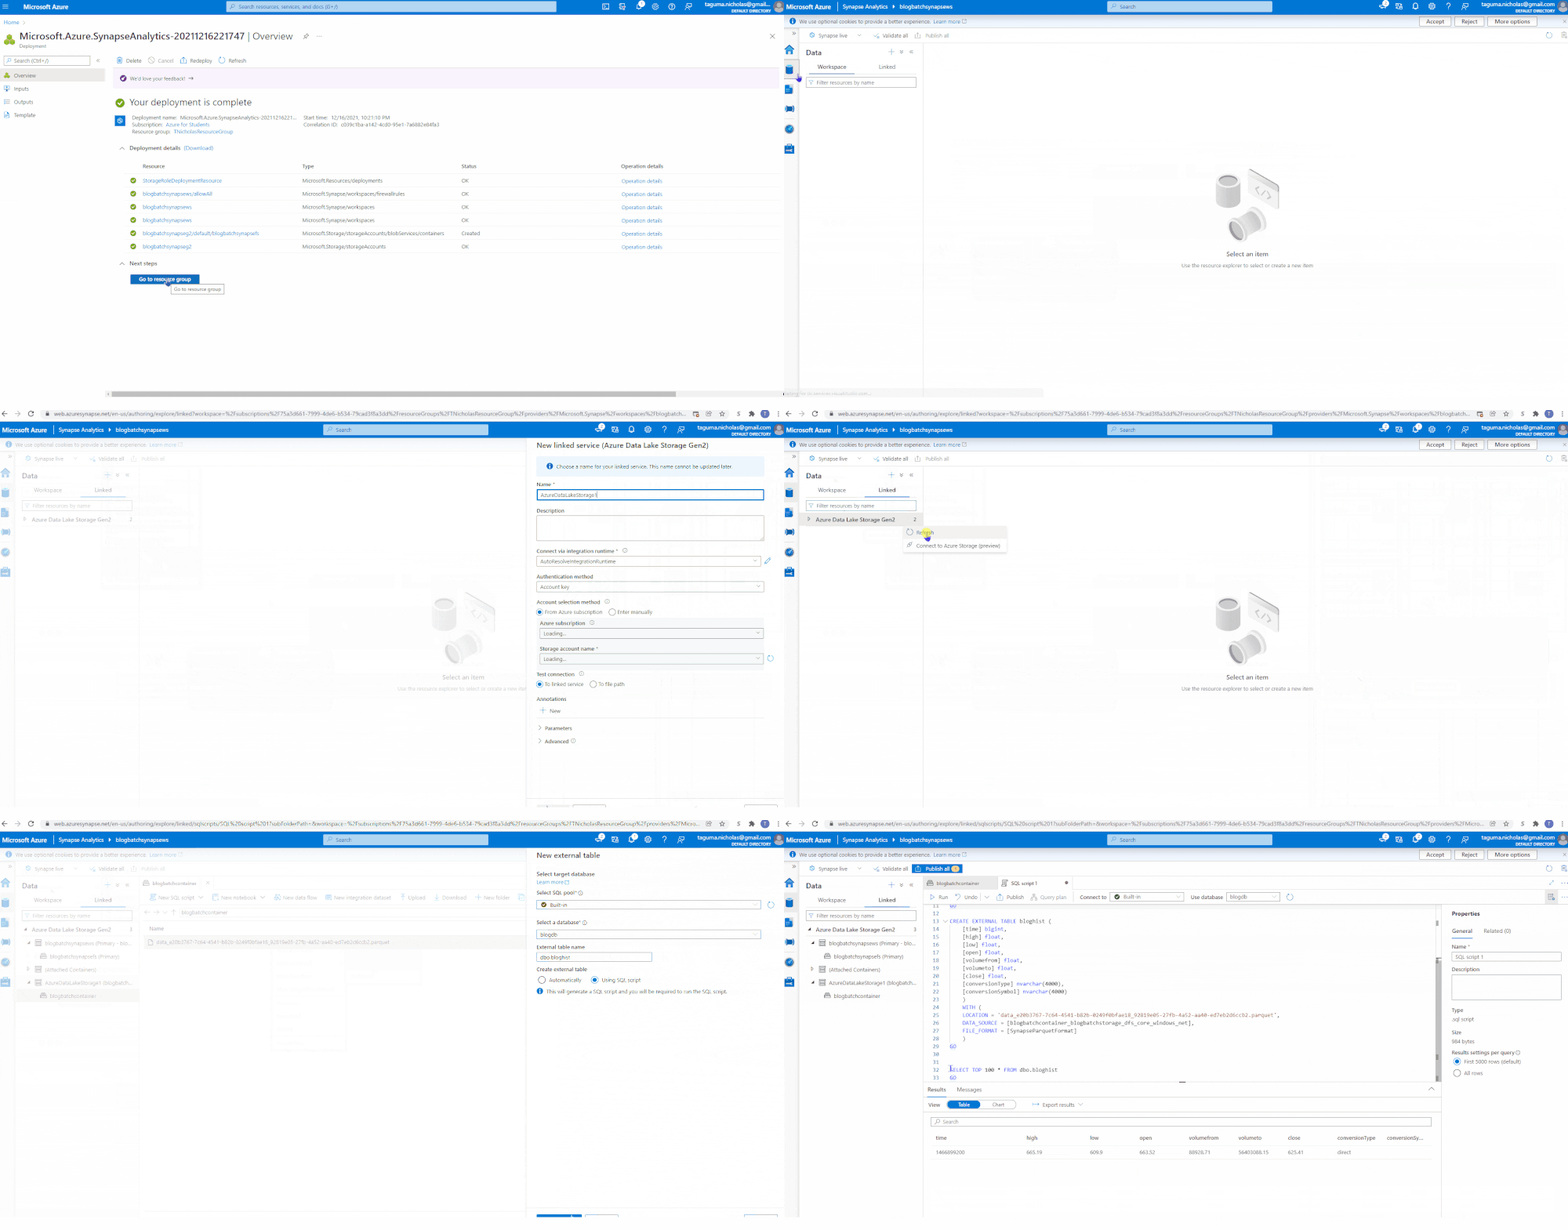
NOTE: A workaround (for demo purposes) is to download the parquet, upload it into the primary system Azure Data Lake Storage Gen 2, and create the external table off that.
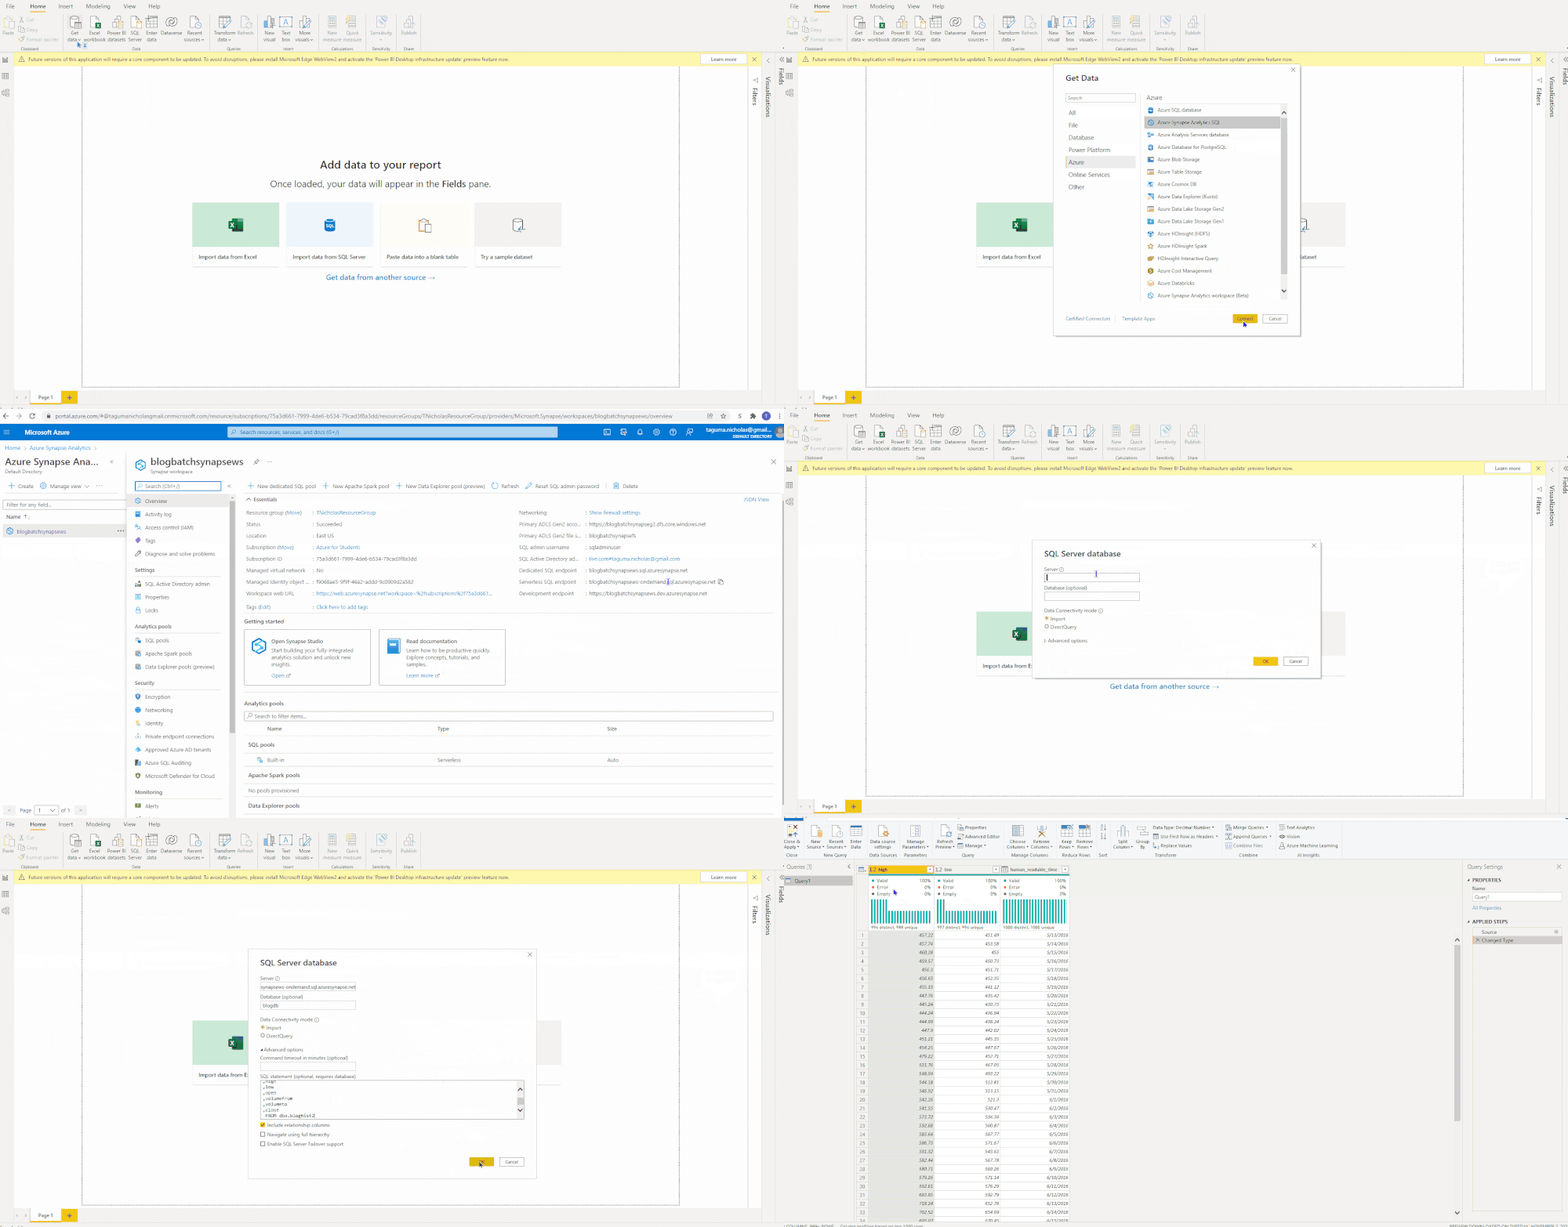
Connect Data to Power BI
In the Get Data Advanced settings, I used the Serverless SQL endpoint as the server and used a query to pull high, low, and time. I used that to create a simple visualization to display BTC Price Highs over time to see the growth trend.

Conclusion
Having worked in Data Management, I know firsthand that everyone thinks their data needs to be near real time. I am here to tell you, IT DOES NOT. Identify critical processes within your organization that require immediate attention and set those to near or real time. While transaction data by nature changes more frequently than master data, it is hard to justify loading it more than daily. Depending on the type of data, establish the load method as either Full Load (flush and fill) or Incremental (load net new records and update changes made to existing records).
Round of applause! You’ve successfully built a batch processing pipeline, retrieved historical data, loaded it into a SQL-like database, and visualized it in Power BI. If you’re looking for additional resources on Power BI and the Azure, see my blog on how to process real time streaming data.


