A task is a fantastic feature in the Snowflake Data Cloud ecosystem that is ideal for defining a regular schedule for running a single SQL query, including a statement that invokes a stored procedure. It also plays an important part in our end-to-end ETL pipeline architecture using task tree.
It should not be a challenge to keep track of the Snowflake tasks and acquire visibility into its operation.
This post covers everything you need to know about Snowflake task monitoring.
Why Should Snowflake Tasks be Monitored?
When handling large & complex data pipelines with tasks or task trees, there’s a good probability that not all of them will execute SQL statements as expected and will fail for various reasons. Snowflake provides many task monitoring features via table functions and views, allowing data engineering teams to find answers to the following questions:
- Is my task running as scheduled?
- What happened to the last run of my scheduled task? Did it fail or succeed?
- If my task fails, how do I get error messages or error codes?
- Why was my scheduled task’s last run skipped?
- Have all of the tasks in the task tree been resumed?
The rest of the post will elaborate on the task monitoring concept using examples and SQL snippets. As a result, you’ll be able to answer the questions above and will gain complete visibility into task/task-tree usage and its functioning.
How to Monitor Tasks in Snowflake
Snowflake includes a table function named TASK_HISTORY, which gives the task usage detail for your entire Snowflake account or a specific task. This TASK_HISTORY table function exists under the information schema where the task or task tree is created.
Let’s say we have a task called DEMO_TASK that runs every five minutes as shown in Figure 1. This task runs a simple SQL statement and uses COMPUTE_WH as a warehouse. Once it has been resumed, using the TASK_HISTORY table function, DEMO_TASK’s usage detail like state (suspended or scheduled), scheduled time, next schedule time, etc. can be tracked.

Figure 1: TASK_HISTORY table function to monitor Snowflake tasks
					-- DEMO_TASK DDL Statement
create or replace task DEMO_TASK
  warehouse = COMPUTE_WH
  schedule = '5 minute'
as
  copy into @my_stage/export/data_ from (select * from orders)
  file_format=(format_name='csv_ff' compression='gzip');

-- resume the task (must have right privilege to run this alter statement)
alter task DEMO_TASK resume;

-- TASK_HISTORY table function to get task usage once resumed
select * from table (information_schema.TASK_HISTORY(TASK_NAME => 'DEMO_TASK'));
TASK_HISTORY SQL Construct, Parameters & Output
Since TASK_HISTORY is a table function and returns set of rows for task usage, Snowflake requires that the table function call be wrapped by the TABLE() keyword. This table function can take up to five arguments and you can narrow down your result set to a specific task or specific time range or fetch only failed tasks.
Figure 2 shows a sample SQL statement where the
TASK_HISTORY table function is called by passing different parameters and it brings a task usage result based on the input parameters.

Figure 2: TASK_HISTORY table function with arguments
					-- TASK_HISTORY table function with argument
select *  from
table(information_schema.TASK_HISTORY(
    SCHEDULED_TIME_RANGE_START=>TO_TIMESTAMP_LTZ('2022-05-26 10:00:00.00 -0700'),
    SCHEDULED_TIME_RANGE_END=>TO_TIMESTAMP_LTZ('2022-05-26 11:00:00.00 -0700'),
    RESULT_LIMIT => 10,
    TASK_NAME => 'DEMO_TASK',
    ERROR_ONLY => TRUE)) ;
TASK_HISTORY Input Parameters
There are no mandatory input parameters for the TASK HISTORY table function and if not specified, it considers the default values and produces the result. The following is a list of arguments and their associated data types.
Argument Name | Must/ Optional | Data Type | Description |
|---|---|---|---|
SCHEDULED_TIME_RANGE_START | Optional | Constant Expression | When set, it brings all tasks where the start time is greater than the task scheduled time |
SCHEDULED_TIME_RANGE_END | Optional | Constant Expression | When set, it brings all tasks where the start time is smaller than the task scheduled time |
RESULT_LIMIT | Optional | Integer | Maximum number of rows returned by the function. Default: 100 |
TASK_NAME | Optional | String | A case-insensitive string specifying a task name. |
ERROR_ONLY | Optional | Boolean | When set to TRUE, this function returns only task runs that failed or were canceled. Default: False |
Important Points to Remember With Input Parameters
- If no start or end time (SCHEDULED_TIME_RANGE_START & SCHEDULED_TIME_RANGE_END) is specified, the most recent tasks are returned, up to the specified RESULT_LIMIT value.
- This function returns task activity within the last seven days or the next scheduled execution within the next eight days.
- The task_name parameter does not support non-qualified task names.
- If multiple tasks have the same name, the function returns the history for each of these tasks.
- This function returns a maximum of 10,000 rows, set in the RESULT_LIMIT argument value. The default value is 100.
- If the number of matching rows is greater than this limit, the task executions with the most recent timestamp are returned, up to the specified limit.
TASK_HISTORY Output Specification
The TASK_HISTORY table function returns a total of 18 columns for the task usage. The most important fields and usage metrics are the state, error code, error message, query start time, and completed time. These important metrics allow you to keep track of the snowflake task and see if it succeeded or failed, as well as how long it took to run the SQL query. Figure 3 depicts a task history output example.

Figure 3: TASK_HISTORY table function output example
The output columns and their associated data types are listed below to aid in the monitoring of the Snowflake tasks.
Column Name | Data Type | Description |
|---|---|---|
QUERY_ID | Text | ID of the SQL statement executed by the task. This will be null if the task is scheduled as a state. |
NAME | Text | Name of the task. |
DATABASE_NAME | Text | Name of the database that contains the task. |
SCHEMA_NAME | Text | Name of the schema that contains the task. |
QUERY_TEXT | Text | Text of the SQL statement. |
CONDITION_TEXT | Text | Text of WHEN condition the task evaluates when determining whether to run. Used with stream objects. |
STATE | Text | Status of the task: SCHEDULED, EXECUTING, SUCCEEDED, FAILED, CANCELLED, or SKIPPED. |
ERROR_CODE | Number | Error code, if the SQL statement returned an error or canceled. |
ERROR_MESSAGE | Text | Error message, if the statement returned an error or canceled. |
SCHEDULED_TIME | Timestamp (LTZ) | Time when the task is/was scheduled to start running. |
QUERY_START_TIME | Timestamp (LTZ) | Time when the query in the task definition started to run. |
NEXT_SCHEDULED_TIME | Timestamp (LTZ) | Time when the standalone or root task (in a tree of tasks) is next scheduled to start running. |
COMPLETED_TIME | Timestamp (LTZ) | Time when the task is completed, or NULL if SCHEDULED_TIME is in the future or if the task is still running. |
ROOT_TASK_ID | Text | Unique identifier for the root task in a tree of tasks. |
GRAPH_VERSION | Number | Integer identifying the version of the tree of tasks that was run, or is scheduled to be run. |
RUN_ID | Number | Time when the standalone or root task in a tree of tasks is/was originally scheduled to start running. |
RETURN_VALUE | Text | Value set for the predecessor task in a tree of tasks. |
SCHEDULED_FROM | Text | Mechanism that prompted the task run. |
To enhance and enrich the task usage output, additional where clause or group by clause can be applied and gain visibility on usage summary for the tasks.

Figure 4: Enhance the TASK_HISTORY table function output
TASK_HISTORY View vs. Table Function
Given that the TASK_HISTORY method delivers task activities for the previous seven days, what if we need utilization metrics over the previous month or longer?

Figure 5: Task Usage Data Limited to 7 days
To fetch historical data beyond the last seven days and next eight days, Snowflake provides a view under the account usage schema also called the TASK_HISTORY view. This view helps us to fetch all task usage within the last 365 days (1 year). The TASK HISTORY view and the TASK HISTORY table function both produce the same results.
There are a few things to remember about the TASK_HISTORY view
- This view resides under the Snowflake usage schema and hence necessary usage grants are required to query the TASK_HISTORY view.
- The latency for the view may be up to 45 minutes. For increased performance, Snowflake recommends filtering the queries using COMPLETED_TIME or SCHEDULED_TIME

Figure 6: TASK_HISTORY view from Snowflake account usage schema
					-- account admin role can access snowflake usage schema
use role accountadmin;
use warehouse compute_wh;

-- query on task history view
select * from snowflake.account_usage.task_history;
By using the TASK_HISTORY view, you can build dashboards and monitor the task’s historical performance and operational efficiencies.
TASK_HISTORY Error Code & Error Messages
The ERROR CODE and ERROR MESSAGE columns capture the failure caused when a Snowflake task fails or is canceled. The TASK HISTORY table function or the TASK HISTORY view can help us figure out why a task failed and how to fix it.

Figure 7: TASK_HISTORY Error Code & Error Message
There are many reasons that your task may end up in error in your production environment and a few command reasons could be:
- Your new release has changed the object privileges that are being used by the task’s SQL statement and the task may not be able to access or authorized to access those objects.
- Object (table, views, and columns) being referred to by task’s SQL statement being altered or dropped can cause SQL compilation errors.
- Task failure could also be caused by the data and SQL expression (such as division by zero).
- Changes in warehouse privileges used by tasks may also raise failure.
TASK_HISTORY & Monitoring Task Tree
The TASK HISTORY function captures task tree use metrics in the same way that it captures task usage metrics. The result of the TASK_HISTORY function captures a unique identifier called ROOT_TASK_ID for the root task in a tree of tasks.
It is a little hard to fetch the task tree using TASK_HISTORY and there is another table function, TASK DEPENDENTS is useful for listing the root task and then the task tree.
					– without recursive flag
select * from table (information_schema.TASK_DEPENDENTS(TASK_NAME => 'TASK_L1_A'));
– with recursive flag set to true
select * from table (information_schema.TASK_DEPENDENTS(TASK_NAME => 'TASK_L1_A', recursive=> true));
The TASK_DEPENDENTS table function list the root task and all the tree element as shown in Figure 7.

Figure 8: TASK_DEPENDENTS table function
So if we have to monitor the task tree using TASK_HISTORY table function or TASK_HISTORY View, the query needs to be filtered using RUN_ID and order the result using QUERY_START_TIME field. Refer to Figure 9 to see what the query and TASK_HISTORY result looks like.
select *  from table(information_schema.task_history())
    where run_id= 1653720967063
    order by query_start_time;

Figure 9: Task History with Run ID for task tree usage
In the case of task tree, only the root task will be listed in the TASK_HISTORY function as scheduled. All the children (tasks) under the root task will not be listed when it is scheduled for the next run. As it starts running, the usage history will be created including the query_id and then we will be able to track it.
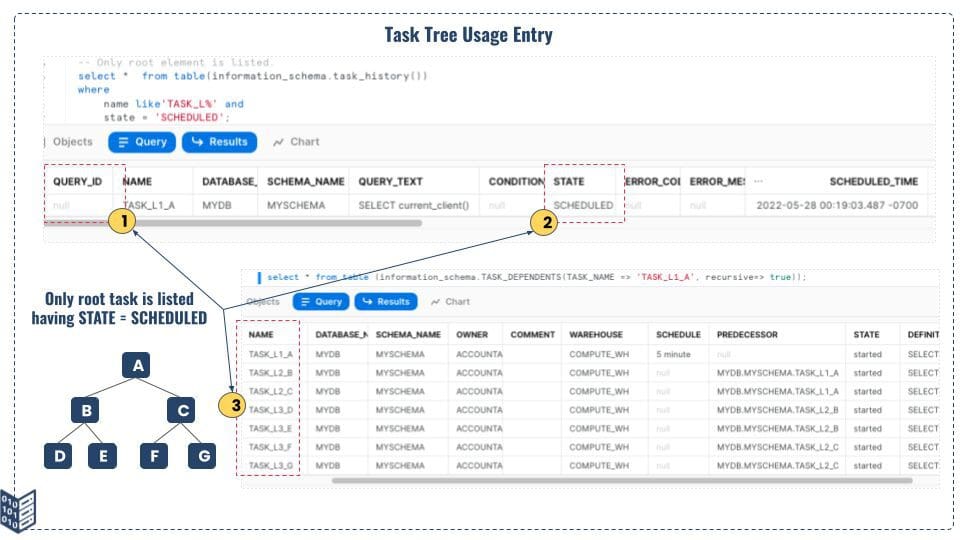
Figure 10: Task Tree Usage & Monitoring Detail
There could be a scenario where some of the child tasks will be suspended, in such a scenario, your TASK_HISTORY & TASK_DEPENDENTS result will look like as shown in Figure 11. In this specific example, task C is suspended and the Snowflake execution engine skips task C as well as all the sub-tasks under task C. So when you monitor the task tree in Snowflake using the TASK_HISTORY table function, make sure to use the TASK_DEPENDENTS table function as well to get the full picture of the task tree and its execution history using run id and query_execution_time fields.
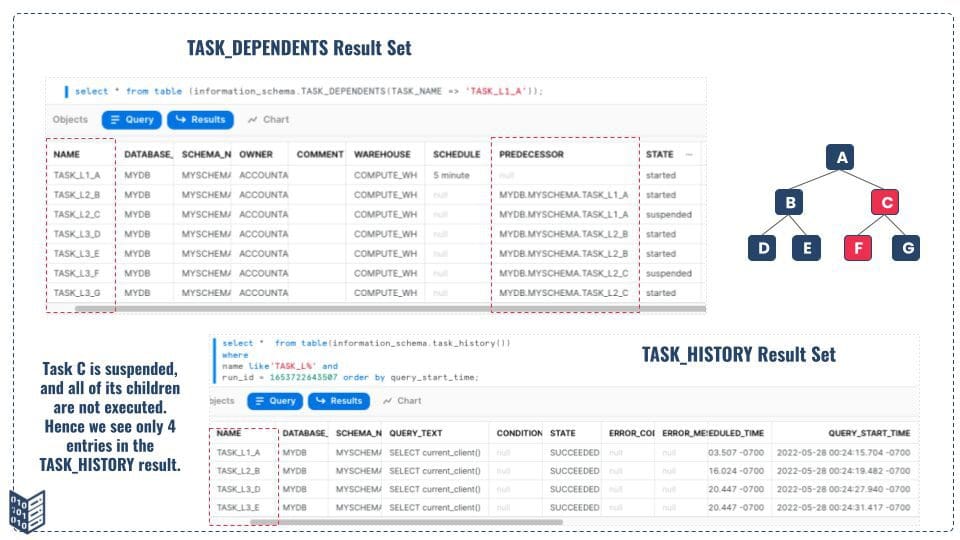
Figure 11: Task Tree and Missing Task Run in Tree Task
Skipped & Canceled Task
There are tasks that use the WHEN boolean expression to run SQL statements. If the boolean expression return false, then the SQL statement is not executed and the scheduled task is skipped.
This happens when we process the stream data based on data available in the stream objects, and if the stream object has not captured any data, the schedule run will be skipped. Refer the Figure 10.1 for how the TASK_HISTORY table function shows the skipped task and associated error code and error messages.
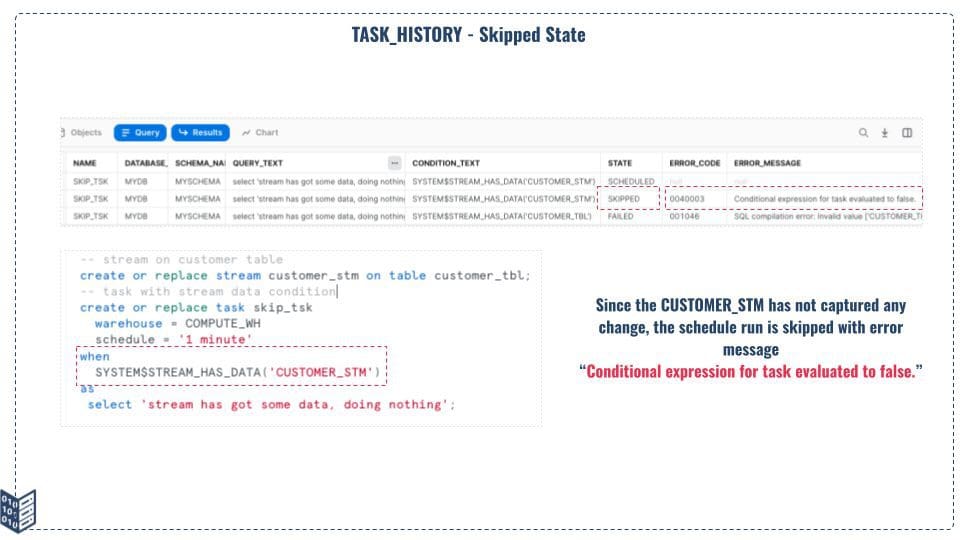
Figure 12: Skipped Task in TASK_HISTORY Table Function
There is another possibility where the SQL statement associated with the task is taking too long and needs to be canceled. In such a scenario, we can execute SYSTEM$USER_TASK_CANCEL_ONGOING_EXECUTIONS by calling the task name and if the task status is in executing state, it will be canceled. Refer the Figure 10.2 how the TASK_HISTORY table function shows the skipped task and associated error code and error messages.

Figure 13: Cancelled State in TASK_HISTORY table function
Serverless Task & Task Monitoring
Snowflake also support serverless task where we can allow the SQL statement to be executed using Snowflake-provided compute power. Like task and task trees, the serverless tasks can also be monitored using the TASK_HISTORY table function. Snowflake does not provide any additional functionality to track the usage of serverless tasks. The SQL code snippet and Figure 11 below explain how serverless tasks can be monitored.
					-- serverless task & its monitoring
create or replace task serverless_tsk
  user_task_managed_initial_warehouse_size = 'XSMALL'
  schedule = '1 minute'
   as
    insert into cust_table (first_name,last_name,date_of_birth,active_flag,city)
    values ('F_Name','L_Name',current_date(),TRUE,'My-City');

-- resume task
alter task serverless_tsk resume;

-- desc the task
desc task serverless_tsk;

– Use the task history table function to fetch task usage detail
select * from table(information_schema.task_history(task_name=>'SERVERLESS_TSK'))
order by scheduled_time desc;

Figure 14: Serverless Task Monitoring
To check the credit usage by serverless task, snowflake provides a separate table function called SERVERLESS_TASK_HISTORY, and this function results in the credit usage by different serverless task.
Tips To Remember
We have covered a lot about task monitoring for various types of tasks (stand-alone tasks, task trees, and serverless tasks) using the TASK_HISTORY table function and TASK_HISTORY view under the Snowflake account usage schema, here are a few pointers:
- A TASK_HISTORY table function can fetch task usage data within the last seven days or the next eight days (for schedule execution).
- TASK_HISTORY view under account usage keeps the last 365 days of data.
- All kinds of tasks including serverless and task tree usage can be monitored using the TASK_HISTORY table function.
Conclusion
We hope you got a clear understanding of how tasks in Snowflake can be monitored and gain full visibility to ensure that all your data pipelines are functioning as expected.
If you need help with monitoring tasks, or any other Snowflake data engineering help, feel free to reach out to the Snowflake experts at phData! We love answering questions and helping businesses get the most out of the Snowflake Data Cloud.


