Recently, a client requested a better end user experience for selecting child accounts under parent accounts. Tableau has always had simple filtering capabilities, but we wanted to provide a similar experience to other web applications or filtering menus. We wanted to recreate Tableau’s “show relevant values” feature without needing to always display each filter layer. Here is how to build a collapsing cascading multi-select filter.
What are Cascading Multi-Select Filters?
Cascading filters are filters that let you drill into a specific selection to decide what to include or exclude. The multi-select means an end user can choose items in different groupings of the date; for example multiple sub-categories across different categories.
Step 1: Identify the Correct Field
In order for this process to work, we need to identify a field that has two different values present for each level of the hierarchy menu. For this example, I chose Order Date because there are at least two different months for each Sub-Category. They don’t need to be the same dates, but there needs to be a minimum of two.

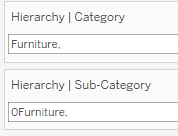
Step 2: Create Category Parameter

Step 3: Create Sub-Category Parameter

Step 4: Create a Placeholder Level 1 and 2 Calculation
					//Hierarchy | Months Min/Max

IF DATETRUNC('month',[Order Date])={FIXED [Category],[Sub-Category]:MIN(DATETRUNC('month',[Order Date]))} then 0
ELSEIF DATETRUNC('month',[Order Date])={FIXED [Category],[Sub-Category]:MAX(DATETRUNC('month',[Order Date]))} then 1
END

Again, note that it doesn’t matter which date are the min and max, only that there is a 0 & 1 for each Category/Sub-Category.

You’ll want to convert this calculation to discrete. Right-click on the calculation and convert to discrete.
Step 5: Create Column Placeholders
					//Hierarchy | Indent
IF  [Hierarchy | Months Min/Max]=1
then 2
ELSE 1
END

Step 6: Create Hierarchy Labels
This field is used to differentiate what should be displayed on the placeholder values created in the Months Min/Max field.
					//Hierarchy | Labels
IF [Hierarchy | Months Min/Max]=0 then [Category]
ELSEIF [Hierarchy | Months Min/Max]=1 then [Sub-Category]
END

Step 7: Create a Function to Update the Category Parameter
					//Hierarchy | Update Category
IF [Hierarchy | Months Min/Max]=0
then IF CONTAINS([Hierarchy | Category],[Category])
        then REPLACE([Hierarchy | Category],[Category]+', ','')
        ELSE [Hierarchy | Category]+[Category]+', '
        END
ELSE [Hierarchy | Category]
END
Translated, this calculation says,
“First, check to see if the selected item is a category (as opposed to a sub-category.)
Then, if the category parameter already contains the category I just clicked on, replace the category I selected with a comma. (This is so we can unselect a category.)
Otherwise, if the category parameter does not already contain the category I just clicked, tack it (and a comma) on to the end of whatever is already in the category parameter. (This is so we can select multiple categories.)
And if what I clicked on is not a category, don’t change anything in the category hierarchy.”

Step 8: Create an Updated Sub-Category Parameter Calculation
					//Hierarchy | Update Sub-Category
IF CONTAINS([Hierarchy | Sub-Category], str([Hierarchy | Months Min/Max])+[Hierarchy | Labels]+', ')
THEN REPLACE([Hierarchy | Sub-Category], STR([Hierarchy | Months Min/Max])+ [Hierarchy | Labels]+', ','')
ELSE [Hierarchy | Sub-Category] + STR([Hierarchy | Months Min/Max])+ [Hierarchy | Labels]+', '
END

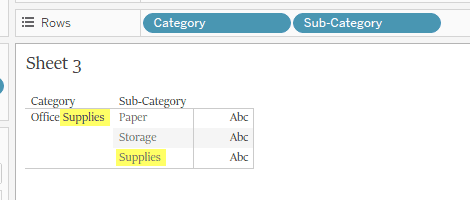
The prefix (str([Hierarchy | Months Min/Max])) is used to distinguish which level an item belongs to. This is to address any issues caused by having the same word in a category and sub-category (i.e., Category of Office Supplies & Sub-Category of Supplies).
Step 9: Create Hierarchy Keep Filter
Next, we will build the functions for filtering out the content we don’t want to display. The first one is used to show the sub-categories of the selected category (CONTAINS([Hierarchy | Category],[Category])) and keep all other category-level items.
					//Hierarchy | Keep
CONTAINS([Hierarchy | Category],[Category])
or [Hierarchy | Months Min/Max]=0

Step 10: Is the Item Selected?
This is where things start to get a little convoluted. The easiest way to think about it is, if it is a Category level item, I need to actively select it. If it is a Sub-Category level item, I need to actively unselect it.
					//Hierarchy | Selected
(NOT CONTAINS([Hierarchy | Category],[Category]))
OR
CONTAINS([Hierarchy | Sub-Category],str([Hierarchy | Months Min/Max])+ [Hierarchy | Labels])

Step 11: Should the Item be Included?
The next step is to determine if the item should be included in the grand total. Remember that since the category and sub-category section/deselecting procedure are opposite; this calculation helps align them.
Here you can see how selected and included to work differently based on if it is a category or subcategory.
					//Hierarchy | Include
IF (not CONTAINS([Hierarchy | Category],[Category])) then FALSE
ELSEIF [Hierarchy | Indent]=1 and CONTAINS([Hierarchy | Sub-Category],str([Hierarchy | Months Min/Max])+[Hierarchy | Labels]) then TRUE
ELSEIF [Hierarchy | Indent]=2 and CONTAINS([Hierarchy | Sub-Category],str([Hierarchy | Months Min/Max])+[Hierarchy | Labels]) then FALSE
ELSE TRUE

END
Step 12: Selected Shapes
					//Hierarchy | Selected Shapes

IF (not CONTAINS([Hierarchy | Category],[Category])) then 'a'
ELSEIF [Hierarchy | Indent]=1 and {FIXED [Category]:SUM({ FIXED [Sub-Category]:Sum(if [Hierarchy | Include] then 0 else 1 end)})}>0 then 'b'
ELSEIF [Hierarchy | Indent]=2 and CONTAINS([Hierarchy | Sub-Category],str([Hierarchy | Months Min/Max])+[Hierarchy | Labels]) then 'a'
ELSE 'c'
END

Want to have a different shape for selected categories vs selected items? Add this line to the selected shapes formula:
ELSEIF [Hierarchy | Indent]=1 and {FIXED [Category]:SUM({ FIXED [Sub-Category]:Sum(if [Include] then 0 else 1 end)})}=0 then 'd'

Step 13: Sales Total
Next to add the sales bar chart we need to calculate the sum and the category and subcategory level in order to have the total bar.
					//Selected Sales Sum
{FIXED [Category],[Sub-Category]:
    SUM(if {FIXED [Sub-Category]:
        SUM({ FIXED [Sub-Category]:
            Sum(if [Hierarchy | Include] then 0 else 1 end)})
        }<=0 then [Sales] else Null END
    )
}
This calculation works by first determining if the sub-category has been selected. If it has been selected it returns the sum for the sub-category. It is important to remember that our menu display is filtered to the first and last month, so it won’t properly return the spend unless we tell Tableau to fix the sum to the sub-category level. Finally, we add the sums of each sub-category (Fix it to the Category & Sub-Category) to calculate the category total bar.
Step 14: Assembling the Menu
- Hierarchy | Indent to Columns
- Needs to be a continuous dimension
- Category to Rows
- Hierarchy | Months Min/Max to Rows
- Needs to be a discrete dimension
- Hierarchy | Labels to Rows
- Hierarchy | Months Min/Max to Filters
- Needs to be a discrete dimension
- Filter to keep 0 & 1 (This is to exclude nulls)
- Hierarchy | Keep to Filters
- Filter to keep True
- Hierarchy | Labels to Label
- Add Hierarchy | Selected to Color
- Hierarchy | Selected Shapes to Shapes
- Change Marks to Shape if you haven’t already
- Hierarchy | Update Category & Hierarchy | Update Sub-Category to details
The following steps are easier to understand if a category and sub-category are selected. Since we haven’t added the dashboards actions yet, you can manually add a selection.
Step 15: Assemble the Bar Chart
- Duplicate the Menu Tab
- Rename to Bars
- Change the mark type to Bar
- Replace Hierarchy | Indent in Columns with Sum(Selected Sales Sum)
- Add Category to Detail
- Change Category from Detail to Color
- This is so the grand total bar can be a different color than the items under it
- Hide Null indicator
Step 16: Assemble the Dashboard
Add a dashboard and place the Menu and Bars sheets on the dashboard.

Step 17: Dashboard Actions
Next, we’ll create the interactions allowing users to select and unselect items.
Create a Dashboard Action change a parameter. It needs to run a select, update Hierarchy | Category Parameter, using the field Hierarchy | Update Category.
Create a second Dashboard Action change a parameter. It needs to run a select, update Hierarchy | Sub-Category Parameter, using the field Hierarchy | Update Sub-Category.
Step 18: Update Formatting
The final step is to clean up the interface and add any design features you’d like. Here are some of the edits I made:
- Hide field labels/headers for rows and columns
- Adjust row height
- Remove column dividers, row dividers, and gridlines
- Turn off tooltips
- Edit shapes for menu
- Change colors for menu
- Change colors for bars
- Added Spend to bar labels
- Edited Menu axis to be fixed between 0-8
- This aligns the format to the left
- Change the font
- Add a slight background to the menu
- Turn on animations
Once completed, you have a more elegant solution for allowing end users to easily select items within different groupings.
To see the final result, check out my dashboard on Tableau Public.
For more examples of creating better end-user experiences, check out these blogs: