

In part 1 of this blog series, you learned how to build a hierarchy filter that operates using set actions. However, due to the inherent limitation of how set actions work, a total of three sheets had to be added next to each other to make it work.
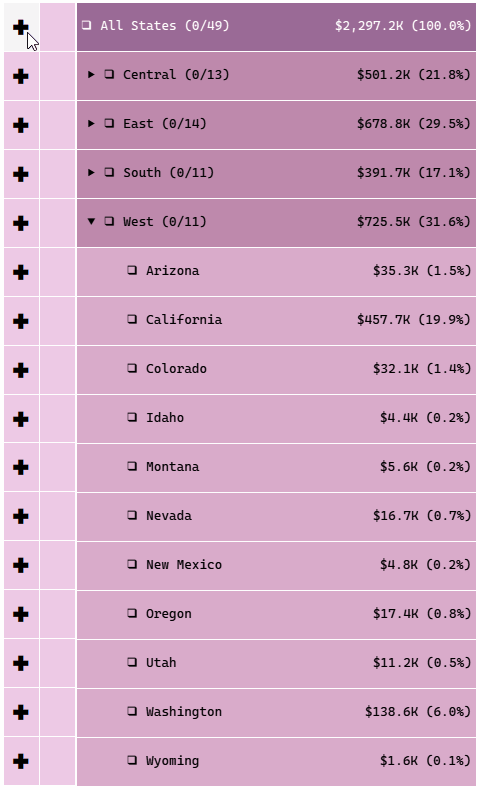
In this blog, as alluded to in the previous part, I will show you how to overcome the limitation of keeping things lined up when dealing with a long hierarchy like Region-State or Year-Quarter-Month hierarchy. I will use the example of building a hierarchy filter for the Region-State hierarchy, as shown below.
Dataset
Use the same Tableau workbook you used for part 1 to follow along. Apply a data source filter for Country = United States.

Step 1: Build the Region-State Hierarchy
Firstly, rename the [State/Province] field to just [State] so it is easier to work with.
![An image showing the the renamed [State/Province] field.](https://i0.wp.com/www.phdata.io/wp-content/uploads/2023/09/image3-12.png)
Also, create folders for storing the Sub-Category calculations and State calculations.

The process of building will be exactly the same as part 1. You can try doing it yourself. The calculations you will need are shown below. Don’t forget to create the [State Set] first.
					//State Level
[Levels]%3
					//State Hierarchy
CASE [State Level]
WHEN 0 THEN "All States"
WHEN 1 THEN "All States" + " >> " + [Region]
WHEN 2 THEN "All States" + " >> " + [Region] + " >> " + [State/Province]
END
					//State Header
CASE [State Level]
WHEN 0 THEN "All States"
WHEN 1 THEN [Region]
WHEN 2 THEN [State]
END
					//State Shape
IF NOT { FIXED [State Hierarchy]: MAX([State Set])} THEN "❑"
ELSEIF { FIXED [State Hierarchy]: MIN([State Set])} THEN "▣"
ELSE "◩"
END
					//State Selection
IF
    [State Level] !=2
THEN
    "(" +
    STR({ FIXED [State Hierarchy]: COUNTD(IF [State Set] THEN [State] END)})
    + "/" +
    STR({ FIXED [State Hierarchy]: COUNTD([State])})
    + ")"
ELSE
    ""
END
					//State Label
SPACE([State Level]*3)
+
[State Shape]
+
" "
+
[State Header]
+
" "
+
[State Selection]
					//State Add
IIF([State Shape]="▣","","✚")
					//State Remove
IIF([State Shape]="❑","","✖")
To quickly create the three sheets needed for the hierarchy filter, duplicate the Sub-Category ones and then replace the pills with the State ones. Drag a State pill on top of the Sub-Category pill to do it.
Alternatively, double-click and change the value in the pill from the Sub-Category to State.
This will retain more bits of formatting information. In the above example, you will not have to untick Show Header when you swap the field within the pill. Similarly, the Add/Remove sheets will retain all the formatting you did on the header when you replace the field within the pill. By swapping dimensions like this, you can also retain the colors assigned from the Colors section of the Marks card.
Use a different color scheme for this hierarchy than the previous one and rename the three sheets to State Hierarchy, State Add, and State Remove.
Step 2: Fix the Problem
The problem here is obvious: there are too many states when looking at all four regions. Tableau doesn’t even show any labels, as there is not enough space.

You could change the fit to standard, and this will add a scroll bar. The constraint is that three sheets should be lined up; otherwise, the Add/Remove buttons will not work on the node shown next to them. It is not possible to do that with three independent scroll bars.
You will either have to do a synchronized scroll or have certain sections collapse/expand on clicking like the classic hierarchy filter.
It is easier to implement the collapse/expand feature for this. In this case, you can expand only one Region to show all its States at a time. To accomplish that, create the following parameter.

Next, create the following calculation.
					//State Drill Down Value
IF [State Level]=1 THEN [Region] END
This will only add the [Region] against the Level 1 nodes. Drag this to the Details section of the All Marks card.
Use that as the Source Field in the Parameter Action, as shown below.

Create this calculation and add it in the Filters shelf with True selected. Apply this filter to all three State sheets.
					//State Drill Down Filter
IIF([State Level] = 2, [Region] = [State Drill Down], TRUE)
With this, only one Region’s States will be visible at one time. The way this particular hierarchy filter is set up to ensure the totals are correct, even though most of the rows have technically gotten filtered out.

Additionally, having a Shape showing which Region is collapsed/expanded will be good. The blank space next to the left of each Region label can be used for this. To do that, modify the [State Label] calculation as shown below.
					//State Label
IIF([State Level] = 1, IIF([State Drill Down]=[Region]," ▼ "," ▶ "), SPACE([State Level]*3))
+
[State Shape]
+
" "
+
[State Header]
+
" "
+
[State Selection]
This will add a ” ▼ ” next to the region that is currently selected in the parameter and a ” ▶ ” against all other regions. Because a mono-spaced font is used, the three blank spaces that would otherwise have been at [State Level] = 1 are now filled with a trailing blank space, a symbol, and a leading blank space.

Step 3: Put it all together
Another weird issue that has now reared its head is the highlighting issue when you click on a region.

To fix this, create the following calculations. Convert them to dimensions.
					//1 X
1
					//0 X
0
Add these in the Detail section of the All Marks card.
Now, duplicate the dashboard with the Sub-Category sheets and swap it with the State sheets as shown below.
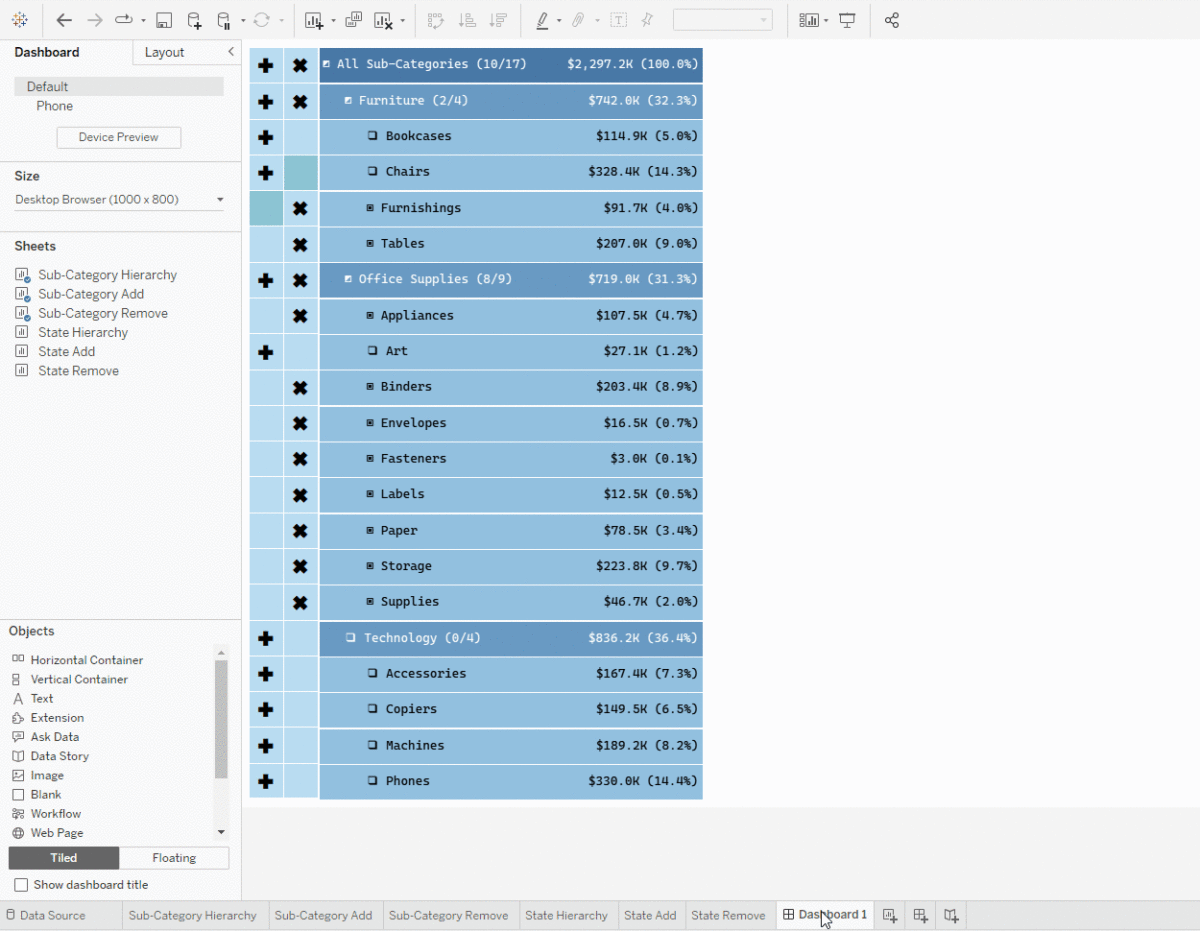
Adjust the width of the sheets. Add the set actions for the State Add and State Remove sheets. Also, change the State Drill Down parameter action to work from the dashboard instead of the worksheet.
To fix the highlighting, create a filter action as shown below.

Check out this blog for more information about this technique. With this, you will have a fully functional hierarchy filter for the Region-State Hierarchy!
Step 4: Build the Year-Quarter-Month Hierarchy Filter
Using the techniques you learned, try building a Year-Quarter-Month Hierarchy with the Quarters and Months for three of the four years collapsed by default, the same as the Region-State hierarchy.
However, unlike the previous hierarchies, the dates are not strings. So, create the following calculations and use them for the subsequent ones.
					//Year
DATENAME('year',[Order Date])
					//Quarter
"Q" + DATENAME('quarter',[Order Date]) + "-" + RIGHT(DATENAME('year',[Order Date]),2)
					//Month
LEFT(DATENAME('month',[Order Date]),3)+ "-" + RIGHT(DATENAME('year',[Order Date]),2)
					//Month Level
[Levels]%4
The Levels.txt had 4 values — 0, 1, 2, and 3 — so a hierarchy of 4 levels such as this could also be created. Remember this: when you use it in your dashboards, have the same number of values as the number of levels in the hierarchy with the most levels. Also, for [Month Level], it wasn’t necessary to use [Levels]%4. Adding [Levels] would yield the same result.
All the other calculations will be very similar to the Region-State hierarchy filter. Your end result would be something like this.

Conclusion
I hope you enjoyed learning how to squeeze in longer hierarchies by making certain sections collapsible. Ideally, you would want to collapse each node, as you can see in this blog. That will be complicated for the end users as you will have four symbols — add, remove, expand/collapse, and fill level — against all the nodes.
Tableau Visionary Rosario Gauna had come up with a solution using parameter actions for building the perfect hierarchy filter, which only needs two symbols. The only drawback is the performance. It will not scale well with data since it relies on parameters and string functions.
Unless Tableau implements the idea of having more options in the set actions as a feature, the multiple sheet + limited collapse is the best option for a hierarchy filter.
If you want more information on Hierarchy Filters in Tableau, contact our team of experts!


