

The filters you add up in a dashboard will often be different hierarchy levels. For example, Region and State or Category and Sub-Category. When filters are added like this, you will lose some much-needed context regarding which sub-categories roll up to which category.
This is not a new problem in Tableau. In fact, this was floated as an idea in the Tableau community almost ten years ago. It is a very practical and intuitive way of filtering, but it takes work to implement in a BI tool.
Over the years, many people have taken a shot at this and have come up with excellent solutions. Check out the examples put out by Tableau Visionaries Rosario Gauna and Marc Reid from the previous link. Using these in actual business dashboards is often impractical because it relies on the performance-draining duo of parameters and string functions.
In this blog, you will learn how to build a hierarchy filter in Tableau that is as fast as regular filters and can be scaled up to work in actual business dashboards. It will be visually similar to the hierarchy filter showcased by Rosario Gauna in her blog and thus will share a few of the initial calculations in common.
Dataset
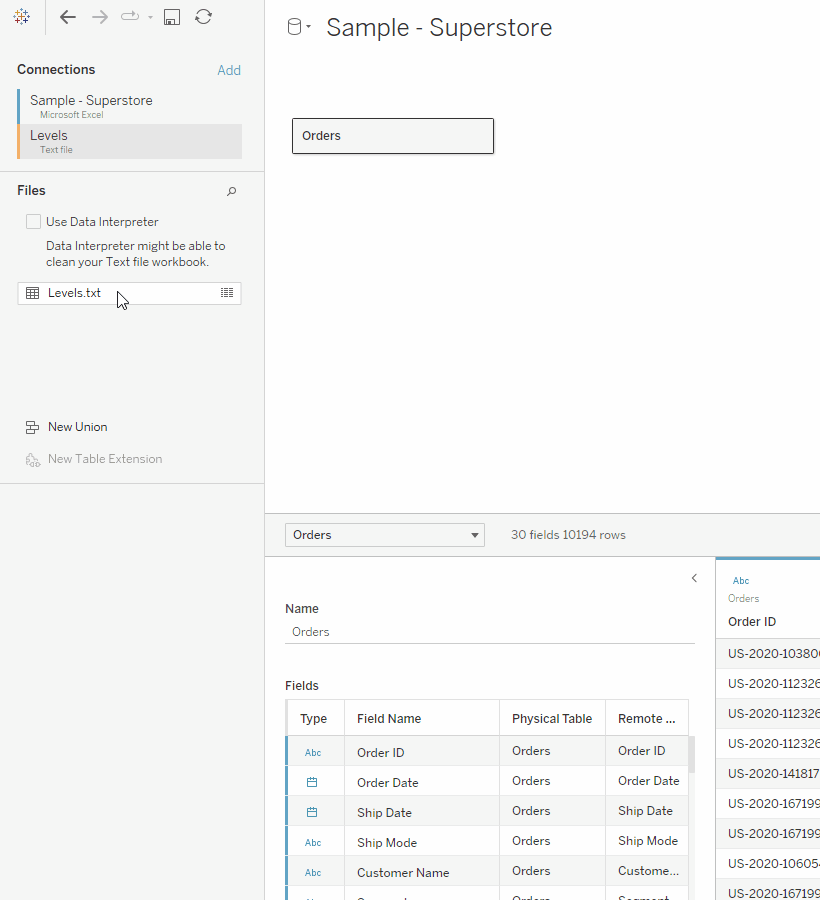
You can follow along with the Orders table of the latest (2020-2023) Superstore dataset. To avoid issues down the line, it is best to use data densification.
To do that, you must create a table with the same number of whole numbers as the number of levels in your hierarchy.
To follow along with this blog, you just need three, corresponding to the three levels: All Sub-Categories, Category, and Sub-Category. But add four so that it is easier to use the same workbook to build hierarchies with four levels that will be covered in part 2 of this blog.
Open a notepad and paste the following in it.
					Levels
0
1
2
3
Save it somewhere, and then in the Data Source pane, add this file as a text file connection and drag it in relation to the Orders table. Then, create a relationship between the two using a relationship calculation of 1=1.
Step 1: Build the Hierarchy
The Levels field has an extra value than what is needed here. So, create the following calculation.
					//Sub-Category Level
[Levels]%3
Convert this to a dimension.
Then, using that, create the following calculation.
					//Sub-Category Hierarchy
CASE [Sub-Category Level]
WHEN 0 THEN "All Sub-Categories"
WHEN 1 THEN "All Sub-Categories" + " >> " + [Category]
WHEN 2 THEN "All Sub-Categories" + " >> " + [Category] + " >> " + [Sub-Category]
END
Drag this in the Rows Shelf, and you will get the following.
![A screenshot showing the [Sub-Category Hierarchy] when added in the Rows shelf](https://i0.wp.com/www.phdata.io/wp-content/uploads/2023/09/image3-3.png)
After this, create the following calculation.
					//Sub-Category Header
CASE [Sub-Category Level]
WHEN 0 THEN "All Sub-Categories"
WHEN 1 THEN [Category]
WHEN 2 THEN [Sub-Category]
END
Next, create a Set using all values from the [Sub-Category] field.
This set will act as the backbone of the entire hierarchy filter. All the sub-categories under a node (or the sub-category itself) clicked in the hierarchy will be added to this set.
Create the following calculation to inform the user which sub-categories/nodes are selected.
					//Sub-Category Shape
IF NOT { FIXED [Sub-Category Hierarchy]: MAX([Sub-Category Set])} THEN "❑"
ELSEIF { FIXED [Sub-Category Hierarchy]: MIN([Sub-Category Set])} THEN "▣"
ELSE "◩"
END
Whenever a set is added inside a calculation, it acts as a boolean calculation, returning True against the rows corresponding to the values in the set and False against the ones that are not. Fixing this at the [Sub-Category Hierarchy] will perform this check for every row in the view. This is an advanced version of the technique explained in this blog.
{ FIXED [Sub-Category Hierarchy]: MAX([Sub-Category Set])} from the “IF” part of the calculation will return True if the Set is not empty for that aggregation level. Adding a NOT before that will return True only when the no values from that node (or that node itself in case of sub-categories) are added in the set. Hence, the empty symbol.
{ FIXED [Sub-Category Hierarchy]: MIN([Sub-Category Set])} from the “ELSEIF” part will return True only if all values from that node (or that node itself in case of Sub-Categories) are added in the set. Hence, the filled symbol.
Nodes that do not fall in either of the two categories, the “ELSE” part, will get the partially filled symbol.
Now, you have everything you need to build the label for the hierarchy with the following calculation.
					//Sub-Category Label
SPACE([Sub-Category Level]*3)
+
[Sub-Category Shape]
+
" "
+
[Sub-Category Header]
The Space function indents each level of the hierarchy by adding three times the number of spaces as the level.
Drag this next to the right of the [Sub-Category Hierarchy] pill in the Rows Shelf.
![A screenshot showing the result of adding the [Sub-Category Label] calculation in the Rows shelf](https://i0.wp.com/www.phdata.io/wp-content/uploads/2023/09/image4-3.png)
Untick Show Header for the [Sub-Category Hierarchy] pill. Right-click on the [Sub-Category Set] and tick on Show Set. This will show a card that resembles the filter card.
Play around with this and watch how the shapes change for the values of the [Sub-Category Label] field.

In addition, another feature you will find in most hierarchy filters is one that indicates the number of child nodes selected against each parent node. To do that here, create the following calculation.
					//Sub-Category Selection
IF
    [Sub-Category Level] !=2
THEN
    "(" +
    STR({ FIXED [Sub-Category Hierarchy]: COUNTD(IF [Sub-Category Set] THEN [Sub-Category] END)})
    + "/" +
    STR({ FIXED [Sub-Category Hierarchy]: COUNTD([Sub-Category])})
    + ")"
ELSE
    ""
END
This calculation will return a fraction showing the distinct count of sub-categories added in the set for a node over the distinct count of sub-categories under that node.
Add this in the Rows shelf to the far right.
![A screenshot showing the [Sub-Category Selection] calculation in action](https://i0.wp.com/www.phdata.io/wp-content/uploads/2023/09/image6-3.png)
It works exactly as expected! Remove the [Sub-Category Selection] pill from the Rows shelf and modify the [Sub-Category Label] calculation as shown below.
					//Sub-Category Label
SPACE([Sub-Category Level]*3)
+
[Sub-Category Shape]
+
" "
+
[Sub-Category Header]
+
" "
+
[Sub-Category Selection]
Step 2: Format the View
To make the hierarchy look much better, you will have to placeholders. To do that, double-click on the Columns shelf and type 1 in the blank pill that opens up. Right-click and convert this to a dimension.
Next, drag the [Sub-Category Label] pill from the Rows shelf to the Label section of the Marks card. Change the Marks type to Bar and add the [Sub-Category Level] in the Colors section.

Now, edit the axis from 0 to 1 and untick Show Header. Change the font (with hierarchies, it is best to use mono fonts), font size, color, color border, etc., to your liking. Set the bar size to maximum and align the label towards the left.

You can add the Sales for each node to provide more context to the users. To do that, Ctrl+drag the 1 field to the right of itself to duplicate it. Then add the Sales on top of the [Sub-Category Label] pill in the 1(2) Marks card to replace it.

Again, edit the axis to go from 0 to 1. Tick on Dual Axis and Synchronize Axis. Add Percent of Totals. Tweak the formatting as needed, and you will have something like this.

When using placeholders, it is often a good idea to alias them so that it is easier to track. Double-click on the first 1 pill and type //Label before the 1.

Hit Shift+Enter and then Enter.

Similarly, alias the other 1 pill as Value.
Step 3: Set up the Actions
As everything is driven by the [Sub-Category Set], you must use Set Actions. Since one sheet can have either the “Add values to set” or “Remove values from set” option, you will need two sheets, one with buttons for adding values to the set and the other to remove values from the set.
To start with, create the following calculation.
					//Sub-Category Add
IIF([Sub-Category Shape]="▣","","✚")
This calculation will only add a “✚” symbol for the [Sub-Category Hierarchy] nodes, which are not entirely added to the set.
Drag [Sub-Category Hierarchy] and [Sub-Category Add] to the Rows shelf on a new Sheet. Set the fit to Entire View. Also, right-click on [Sub-Category Set] and tick Show Set.
![A screenshot showing the [Sub-Category Add] calculation in the Rows shelf](https://i0.wp.com/www.phdata.io/wp-content/uploads/2023/09/image13-3.png)
The objective is to add all the sub-categories that roll up to a node (or the node itself) to get added in the [Sub-Category Set] when the corresponding “✚” is clicked on. The way the hierarchy is built is conducive to this. To see why, drag [Sub-Category] in the Rows shelf.

When a “✚” is clicked, every sub-category next to it must get added to the set. Add a set action like the one shown below.

It works as expected! Try it out! Note that you will have to deselect using the set that was shown.
The [Sub-Category] pill in the Rows shelf could be more user-friendly. To fix this, drag it into the Marks card’s Detail section. Change the Marks type to Polygon.
On a side note, since the [Sub-Category Add] is added in the Rows shelf, setting the Marks type to Polygon was unnecessary. Bar/Area also would have sufficed. However, if you use the placeholder technique to create this sheet, you must make a dual axis of two placeholders, one with the “✚” and another with the Marks type set to Polygon with [Sub-Category] pill in Detail.
Hide the [Sub-Category Hierarchy] pill, Left align the [Sub-Category Add] field and format the sheet. You will get something like this.

Now, duplicate this sheet to create the sheet that will remove the sub-categories when clicked. To do that, replace the [Sub-Category Add] calculation with the following.
					//Sub-Category Remove
IIF([Sub-Category Shape]="❑","","✖")

Also, edit the duplicate set action that was created as follows.

Play around with Sheet 2 and Sheet (2) to try adding/removing sub-categories from the set.
Step 4: Add in a Dashboard
Rename the sheets Sheet 1, Sheet 2, and Sheet 2 (2) as Sub-Category Hierarchy, Sub-Category Add, and Sub-Category Remove, respectively. Hide the Show Set Card and other Legend Cards on the three sheets.
Create a new dashboard, add a horizontal container, and then a blank object. Drag the Add, Remove, and Hierarchy sheets, in that order from left to right, inside this horizontal container.

Change the width of the Add and Remove sheets to 40 pixels each, hide titles, remove unnecessary padding, etc.
Then, update the two Set Actions to run from the Dashboard, as shown below.

Once you finish that, you will have a fully functional hierarchy filter!

This particular variant of the hierarchy filter has many advantages:
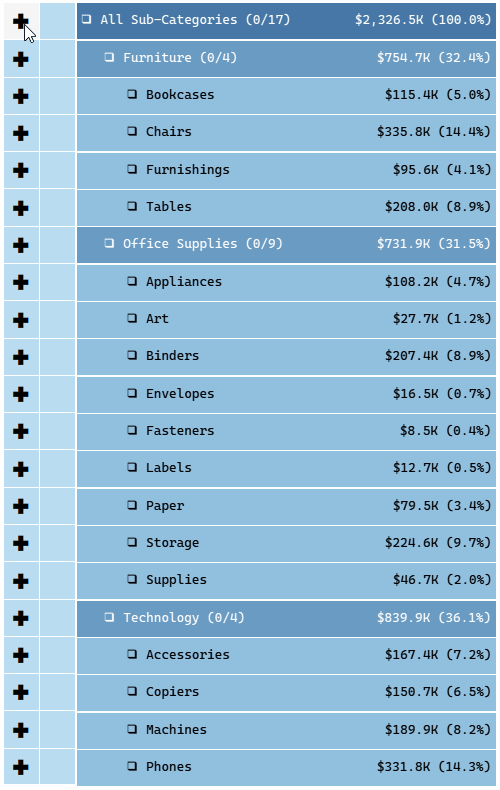
Adding the number of sub-categories that roll up to the node, sales, and percent of totals for sales provides some vital additional context for the users.
Add the
[Sub-Category Set]to apply the filter in any Filters shelf. The filtering action will be as fast as a regular dimension filter.Since the set keeps track of everything and the calculations determining the shapes run directly on it, it scales extremely well with data.
New categories and sub-categories will directly get added to the hierarchy filter without any manual intervention.
For some additional flexibility, the set can be added inside calculations while filtering. This will be explained in more detail in Part 3.
Having separate add and remove selection buttons makes completely removing/adding a partially selected node a one-click action. It is a bit of a stretch, but I love it.
That being said, there is one drawback with the way this hierarchy filter works.
Since there are three sheets side by side and all of them must be lined up, you cannot use a hierarchy that is more than a page long unless you do some form of synchronized scrolling or have some sections of your hierarchy collapse (a variant of this will be explained in part 2,) so that the three sheets are lined up.
However, the scales often start tipping in favor of having a few disparate filters over a hierarchy filter when you have a long and/or a very ragged hierarchy anyway. So, pick the scenarios where you will employ this, bearing this limitation in mind and with adequate foresight.
Conclusion
It is worth mentioning that the major drawback of this method was the inability to configure two types of set actions in one sheet. Tableau Visionary Rosario Gauna added an idea to the Tableau forum a few months ago that will resolve this. It is a minor update, but it will be a game-changer!! Support this idea if you have made it so far. The more, the merrier.
Hopefully, you enjoyed learning this rather intricate technique of building a hierarchy filter. It is fast and intuitive, scales well with data, and doesn’t look bad. Use it in your dashboards to give your users a unique filtering experience.
contact our team of experts!


