

Why do you need to know the parts of a Snowflake query?
Running a query in the Snowflake Data Cloud isn’t fundamentally different from other platforms in the fact it takes in SQL and gives you back results. What is different is how Snowflake goes about the query process to make it more modular and configurable. While this gives you more flexibility to query your data, it can also result in vastly different query times and even return different query results based on the warehouse you choose and the security role you define as part of the query.
Because of this, it’s critical to understand the fundamentals before you can optimize your Snowflake query performance and limit your credit consumption.
In this article, you will learn the four parts of a Snowflake query, how it unlocks greater query flexibility, and how this differs from legacy data warehouses.
To kickstart your journey to the Snowflake Data Cloud, check out this guide for practical tips and guidelines to consider.
The Four Parts of a Snowflake Query
Role

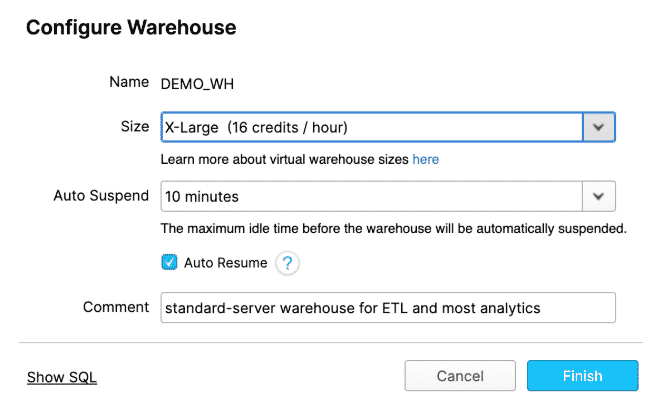
Warehouse
The next piece of context you will need to select is a warehouse. A warehouse is a set of compute resources. Default warehouses have one cluster of resources behind a warehouse, but Enterprise Edition accounts can have multi-cluster warehouses. Multi-cluster warehouses are used to control user and query concurrency.
A warehouse is technically known as a virtual warehouse because no data is associated with the warehouse itself, only compute resources.
The size of the cluster behind the warehouse is an important tuning parameter for both performance and cost. One simple rule is that each warehouse is twice as large as the previous warehouse and query performance roughly follows the same scale. Of course, since Snowflake is truly a Cloud/SaaS offering you can auto-suspend and auto-resume warehouses.
Database and Schema
A database belongs to exactly one Snowflake account and contains schemas. While a schema belongs to exactly one database and contains database objects such as tables, views, etc.
In Snowflake when you want to query, you have to choose both a Database and Schema. Together a database and schema are called a namespace. Unlike Oracle where a schema is confusingly equal to a user, a schema is simply another level of organizing tables.
This means the full coordinates to a table in Snowflake require the database, schema, and table name. That’s slightly more complex than, say, Apache Hive which has a one-level hierarchy where the term database and schema are synonymous. However, I prefer the two-level hierarchy of database and schema because it ends up being simpler to use and easy to understand.

Running a Query


Conclusion
That’s it! Now you understand the basic structure of Snowflake. Go forth and query!
To kickstart your journey to the Snowflake Data Cloud, check out this guide for practical tips and guidelines to consider.
If you’re looking for additional information on managing your credit consumption and monitoring your Snowflake query performance, check out phData PAMS. This is a tool for log collecting, monitoring, and alert management that we offer as part of our services.
And, as part of our Cloud DataOps service, we also provide Snowflake Monitoring and Dashboard reporting to monitor query, credit, and usage consumption from your Snowflake environment.
Common Snowflake Query Questions
Honing in on per query cost can be an art form due to factors that aren’t related to the query. Including auto suspend time, concurrent query usage, and whether or not the query requires a warehouse. But, the general way of finding this out is by taking the query execution time and multiplying it by the size of the warehouse. Ex: 1 minute query in XL warehouse => (1 minute / 60 minutes) * 16 credits per hour for XL = 0.27 credits * per credit cost ($4) = $1.07.
After executing a query in the notebook, the results will come back at the bottom of the screen under the “Results” tab. If you are accessing Snowflake via a BI tool or other connection, the results will show up to populate a report, dashboard, or variable for code execution.
This is a bit more of a complicated ask because it requires more than looking through the history table. There are queries that you can run against system tables to estimate how this is tracking over time. But the ultimate solution requires metadata and pipeline tracking to ensure you are comparing the correct query and process.


