Recently Luke Stanke and myself held a webinar discussing some cool ways to enhance P&L statements and other financial reporting. This blog post contains detailed instructions on how to use some of the techniques that I presented.
In this blog post you’ll learn how to:
- Create dynamically expanding and collapsing Rows
- Create dynamically expanding and collapsing Columns
- Create a table that allows both dynamic Row and Columns
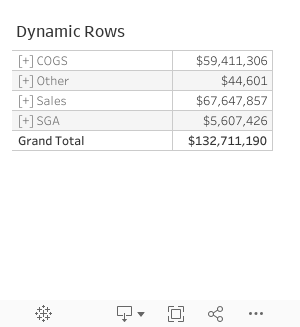
1. Dynamic Rows
First, let’s look at the problem that we’re solving for. When looking at different granularities of data, Tableau users often opt for showing each hierarchy of data using the higher level and lower level as blue pulls in your rows to create images like the one on the bottom left. This does show the different breakouts, but it’s static, takes up a lot of real estate, and make not be the most aesthetically pleasing look.
A lot of the same things can be said for the bottom right technique. Instead of putting the two pills in the same view, a filter action is used to filter down the second tier of data based upon the values selected in the first table showing the higher granularity of data.

Although both of these techniques are valid, I want to show you a technique that might help consolidate these views into a much simpler view. To give context, you can also find something similar to this first technique in this blog by Katrina Johnson. I originally used this concept in my NCAA KPI dashboard using the technique that Andy Kriebel describes in this Youtube video.
Our goal is to create a table where we can click on a Category (in this instance, the tier 1 granularity) and then see the Sub-Category (tier 2 granularity) data for that Category that you selected. First, let’s create a Set using the values in our tier 1 Category field.
Next, we must create a field saying that if a Category is included in the Category Set that we just created, that we’ll show an indicator that the field is expanded or collapsed using the [-] or [+] text. See the calculation below.
//Category Show
IF [Category Set]
THEN "[-] "
ELSE "[+] "
END + [Category]
Next, let’s create the field that will show the tier 2 Sub-Category field if the tier 1 Category is in our Set. This calculation essentially says, if the Category is in the Set, then return the Sub-Category field, and if not, return a blank value.
//Sub-Category Show
IF [Category Set]
THEN [Sub-Category]
ELSE ""
END
Finally, let’s place the Category, Category | Show, and Sub-Category Show fields onto rows. Add the proper field to the Text in the marks card to complete the table.

Finally, add a Set Action that adds Categories to the Category Set on a click and the removes all values from the Set when clicking off.

See the example dashboard below:
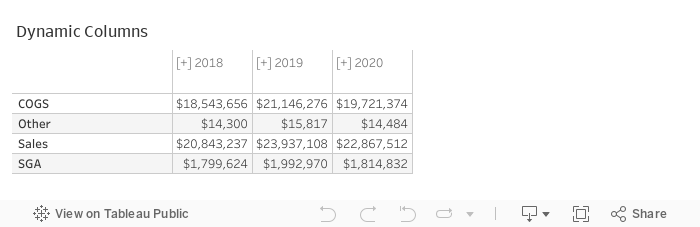
2. Dynamic Columns
In this section I am going to show you how to create the same functionality for the Category and Sub-Category in the rows for different time periods in your columns. For our use case I am going to show you how to drill from Years to Quarters in your columns.
First, let’s create a field that just contains the Year of all the dates in our data set. To create this field I use the formula DATEPART(‘year’,[Date]) and then make that field a Discrete Dimension formatted as a Whole Number. Also do the same for the Quarter of each Date. I’ve named each field [Date | Year] and [Date | Quarter], respectively.
Next, we need to create our Year Set that will contain the years that we click on in our table to drill into.
Next, let’s create our tier 1 and tier 2 fields that we want to start on and drill into. These calculations are essentially saying, if a year is in our Year Set, then show the Year with a [-] + the Year and then also show the Quarter. If the year is not in the Year Set, show the Year with the [+] text and then return blank for the Quarter.
//Year | Show
IF [Date | Year Set]
THEN "[-] "
ELSE "[+] "
END + STR([Date | Year])
//Date Quarter | Show
IF [Date | Year Set]
THEN STR([Date | Quarter])
ELSE ""
END
Let’s drag our Year(Date), [Year | Show], and [Date | Quarter Show] fields to the Columns and add our [Date | Year] field to our Detail in the marks card.

Just like with the dynamic rows, add in a Set Action controlling what’s added to the Year Set and your dashboard should expand and contract by clicking on the Year.

See the example dashboard below:
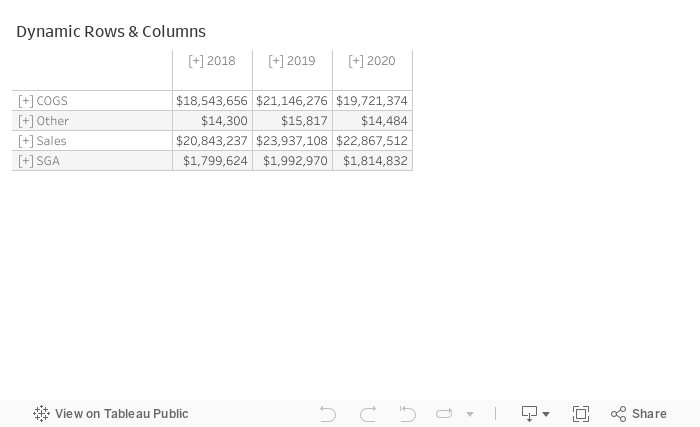
3. Dynamic Rows & Columns
Now that we’ve determined how expand our rows and columns, this last part will show you how to combine the two! This is going to be tricky because anytime you click on the year in the columns it will automatically select all of the Rows which, by default, adds all of the Categories to the Set. The same goes for clicking a Category and selecting all of the Years. We are going to use a a Level of Detail calculation that counts the total number of items in a Set to get around this. Let’s dive in.
First, let’s create two calculations, each return how many values are in our Sets (Year and Category).
//Category | Show | SA Count

{ FIXED [Category Set]:COUNTD([Category])}
//Year | Show | SA Count

{ FIXED [Date | Year Set]:COUNTD([Date | Year])}
Next, let’s use that logic to create the same sort of Show fields as we used in our original Row and Column Show fields. These fields are going to be our tier 1 granularity fields.
//Category | Show | SA Combo

IF [Category | Show | SA Count]>1
THEN "[+] "
ELSE "[-] "
END + [Category]
//Year | Show | SA Combo

IF [Date | Quarter Show | SA Count]>1
THEN "[+] "
ELSE "[-] "
END + STR([Date | Year])
Now we need to create the logic for our Quarter and Sub-Category fields, or tier 2 granularity fields, to show at the proper time.
//Quarter | Show | SA Combo

IF [Year | Show | SA Count]=1
THEN STR([Date | Quarter])
ELSE ""
END
//Sub-Category | Show | SA Combo

IF [Category | Show | SA Count]=1
THEN [Sub-Category]
ELSE ""
END
Now let’s drag all of the appropriate fields to their places in the Columns and Rows. Make sure to keep both of the previous Set Actions for the worksheet so that both of them will be functioning at the same time.

Let’s break down the logic on the count fields for a second so you can understand how this is working. as you can see below, when all of the Quarters are exposed, the [Year | Show | SA Count] field =1 for each of the values. The [Category | Show | SA Count] field = 4.

When the Sub-Categories are showing for a specific Category, the [Year | Show | SA Count] field =3 for each of the values and the [Category | Show | SA Count] field = 1. Hopefully now the logic in the Quarter and the Sub-Category Show SA Combo fields makes more sense.

Finally, let’s combine the two and see what happens when we click on a field in the middle. Both of the Count fields are 1. Now when we select a Year and then a Category, because both of these fields will now be 1, only this combination of Year/Category will show. You can still click on a Year to see just the quarters for that year, and same for clicking on a Category to see a Sub-Category, but you can now click on a Year/Category combination in the table and only that combination will open up.

See the example dashboard below: