In this post we continue our ultimate guide to tables in Tableau by discussing how to create pagination in Tableau.
Sometimes our tables are too long in Tableau–and sometimes we want to combine sheets too make a single table. We can do this with pagination! And when you think about it, most tables we interact on the web has pagination.
This blog post will show you how to create pagination. This solution requires 4 sheets: one for the table, one for the numerical display, one for the left arrow, and one for the right arrow. We’ll start with the table, get it set up, then transition to the arrows, and finally create the display.
For this example you’ll utilize the Sample – Superstore dataset.
Step #1: Build the base table.
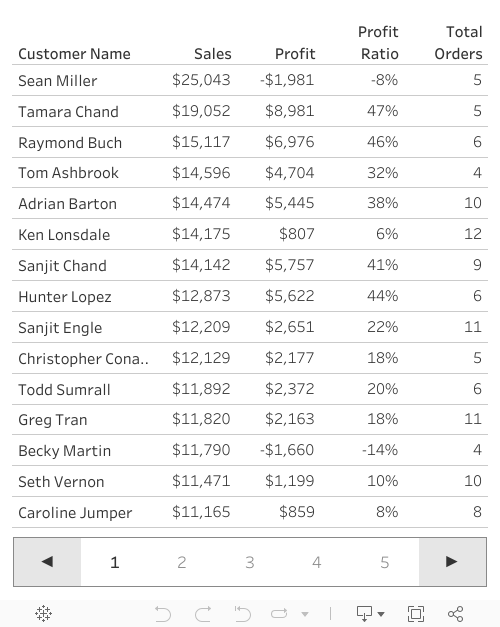
Add [Customer Name] to rows. Sort this dimension descending using sum of Sales.
Next you’ll create the measures that will be on the table. You’ll then use [Measure Names] and [Measure Values] to build the table.
This table includes total sales, total profit, profit ratio, and total orders. Sales and profit are base measures, but you’ll need to build profit ratio and total orders. Here is profit ratio:
// Profit Ratio
SUM([Profit])/SUM([Sales])
and total orders:
// Total Orders
COUNTD([Order ID])
Now bring [Measure Names] to columns and [Measure Values] to text. Be sure that SUM(Sales), SUM(Profit), Profit Ratio, and Total Orders are in the [Measure Values] card.

Step #2: Build the framework for pagination


Now it’s time to begin building the pagination! First you’ll start with a calculation called [Customer Name | Index]. This function just applies the INDEX() function.
// Customer Name | Index
INDEX()
This calculation will come in handy for building your other calculations. Your next calculation is called [Page | Customer Name | Index]. This will calculate which rows to show on which page.
// Page | Customer Name | Index
((([Customer Name | Index] - 1) - (([Customer Name | Index] - 1) % [rows to show]))/[rows to show]) +1
Now you simply need to create a calculation that shows which page to show. You will create a boolean bases on the page parameter called [Page Number | TF].
// Page Number | TF
[Page | Customer Name | Index] = [page number]
Add [Page Number | TF] to filters and select TRUE. You will now see 15 rows from page 1. This is bases on the [rows to show] and [page number] parameters. This leaves you with the following visualization:

Step #3: Build the Left Arrow
'◄' to text. Align the text to the center-middle. Next, create a calculation called [Page | -]. This calculation will subtract one value of the page number unless you are at the lowest number.
// Page | -
IF [page number] = 1
THEN 1
ELSE [page number] - 1
END
Add [Page | -] to detail.
Additionally, create two more calculations: [TRUE] where the calculation is equal to TRUE. And [FALSE] is equal to FALSE. Add these calculations to detail, as we’ll. Finally, be sure to turn off tooltips.
Step #4: Build the Right Arrow.
"►" to text. Align the text to the center-middle. Next, create a calculation called [Page | +]. This calculation will add one value of the page number unless you are at the highest page number.
// Page | +
IF [page number] = FLOOR({COUNTD([Customer Name])}/[rows to show]) +1
THEN FLOOR({COUNTD([Customer Name])}/[rows to show]) + 1
ELSE [page number] + 1
END
Add [Page | +], [TRUE], and [FALSE] to detail. A turn off tooltips.
Step #5: Build the page navigator

Each index value is a product and its rank on sum of sales. Let’s add some text to this visualization showing the page number. You’ll also set the selected page number to be a darker color and bolder font.
You’ll create two calculations for the labels: [Label Page Number] for the selected label page and [Label Page Number Not] for the pages that are not actively selected.
// Label Page Number
IF [Page Number | TF]
THEN [page number]
END
// Label Page Number Not
IF NOT [Page Number | TF]
THEN [Page | Customer Name | Index]
END
Add both of the measures to text on the marks card. Change both to discrete (it helps with number formatting). Edit the table calculations and choose Specific Dimensions and Select [Customer Name] for both measures.
From there and edit the text. Place the two dimensions on the same line. For [Label Page Number Not] select a lighter gray, Tableau Book, Size 12. For [Label Page Number] select black, Tableau Semibold, Size 12.

That leaves you with the following:

The [Customer Name | Index] shows all customers, but we don’t really need to show all the customers, we need to just show a single customers from a single page. The best thing we can do is just show the first customer from each page–since the last page might only consist of that single customer.
Write the following formula called [Page n | 0]:
// Page n | 0
([Customer Name | Index] % [rows to show]) - 1
Move this measure to a dimension and place it on filters. Edit the table calculation of the filter. Be sure Specific Dimensions are used and [Customer Name] is selected. Then select 0 from the filter options. This results in the following visualization:

The last bit is the hardest part. We need to know which pages to show. This is about setting a range: a lower-bound and an upper-bound. We will do that with two calculations called [threshold | bottom] and [threshold | top].
// threshold | bottom
IF [page number] < 3
THEN 1
ELSEIF [page number] > FLOOR({COUNTD([Customer Name])}/[rows to show]) - 1
THEN FLOOR({COUNTD([Customer Name])}/[rows to show]) - 3
ELSE [page number] - 2
END
// threshold | top
IF [page number] > FLOOR({COUNTD([Customer Name])}/[rows to show]) - 1
THEN FLOOR({COUNTD([Customer Name])}/[rows to show]) + 1
ELSEIF [page number] < 3
THEN 5
ELSE [page number] + 2
END
And finally we’ll build a single calculation that will define the upper- and lower-bounds in a single calculation.
// theshold | tf
[Page | Customer Name | Index] >= MIN([threshold | bottom])
AND
[Page | Customer Name | Index] <= MIN([threshold | top])
Note: the values here are hard-coded so that 5 pages will show at any given time.
Add [threshold |tf] to filter. Edit the table calculation, choose Specific Dimensions and select [Customer Name]. Then set the filter to True:

Now you just need format by removing row dividers and hiding headers. And align text to the center-middle. Finally add [TRUE] and [FALSE] to detail.

Step #6: Build the Dashboard

Step #7: Add dashboard actions
The first the parameter action will be for the right arrow. Change the [page number] using [Page | +] with no aggregation on select.

The second the parameter action will be for the left arrow. Change the [page number] using [Page | -] with no aggregation on select.

The the the parameter action will be for the display. Change the [page number] using [Label Page Number Not] with no aggregation on select.

Finally we need to make 3 separate filter actions, one for each sheet with an action. On select of the left arrow drive an action to the left arrow sheet. On deselect, show all values. Set the target filters on selected fields when [TRUE] is equal to [FALSE]. Repeat for the display and right arrow.

So whats the final result?
This table: