This Twitter Ads Tableau Dashboard example illustrates the engagement and effectiveness of Twitter’s digital ad campaigns. To better understand campaign performance, users can see significant trends and KPIs related to engagement, conversion, and cost.
Insights from this Tableau dashboard can be used to improve Twitter’s ongoing campaign strategy by optimizing resource allocation and maximizing engagement.
Example
Who This Dashboard is For?
This dashboard is meant for marketing managers and executives interested in optimizing their digital marketing strategy. Ultimately, this dashboard can help marketing teams easily identify opportunities to maximize engagement while considering cost impact.
What You Can Accomplish With Dashboard
1. Overview
The Overview tab is meant to give the user a high-level look into critical KPIs and overall performance during the specified time period.
Icon Info:Hover over the info icon in the upper right corner to see the KPI acronyms defined.
Filters: Use the ‘Select Time Period’ filter to view the YTD or MoM KPI metrics.
Additional Features: Use up/down arrows in the ‘YTD CAMPAIGN PERFORMANCE METRICS’ chart to sort by desired metric and direction.
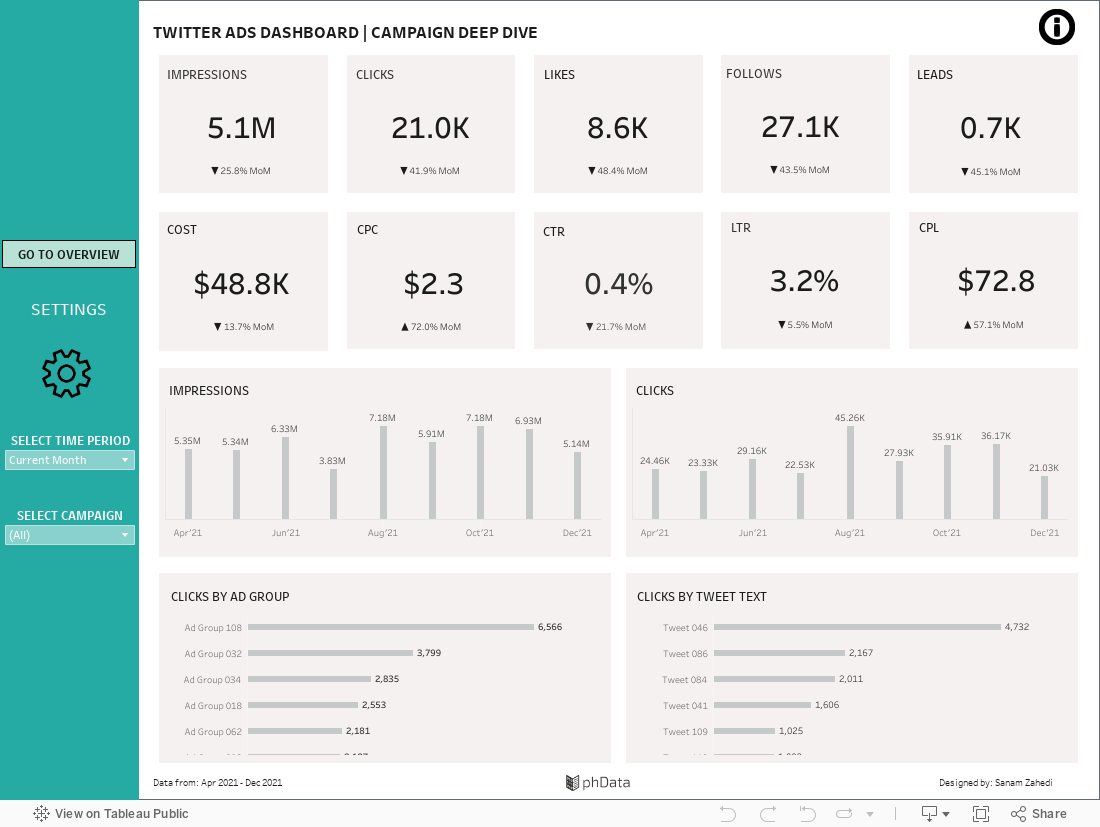
2. Campaign Deep Dive:
The Campaign Deep Dive tab offers a granular view of the performance metrics and trends from the perspective of each individual campaign. This tab is meant to help the user understand which campaigns drive the most engagement with cost efficiency in mind.
Info Icon: Hover over the info icon in the upper right corner to see the KPI acronyms defined.
Filters: Use the ‘Select Time Period’ filter to view the YTD or MoM KPI metrics. Use the ‘Select Campaign’ filter to view the campaign-specific metrics.
We hope you found this Twitter Ads Tableau Dashboard useful as a tool in your journey to optimize your digital marketing strategy by driving engagement and implementing an efficient investment strategy. Have dashboard design questions? Our team of Tableau experts is here to help.