

This is a follow-up to our Building an Emotion Classification System for Videos with Deep Learning post.
We all know that adopting artificial intelligence at enterprise scale can be challenging and that the challenges don’t stop once a machine learning (ML) model has been developed and trained. Deploying a model to production and integrating it into business processes can be a significant source of difficulty and a common point of failure for ML projects. Strong investments in MLOps capabilities can help ease this process, but good tools also go a long way. Dataiku Data Science Studio (DSS) is a powerful tool for developing ML models, but it can also streamline the deployment of those models.
This tutorial is the second part in a series focused on Emotion Classification for Videos. In the first tutorial, we explained how to develop a deep learning model that could accurately classify the emotion of a video subject. In this post, we outline the steps necessary to expose that model as an API endpoint and develop a simple web application that allows users to upload new videos for classification.
Prerequisites (Steps 1-4)
The tutorial below assumes that you have already trained a model for emotion classification following the previous tutorial in this series, which contained Steps 1-4 on this journey. Here, we start at Step 5, which is the first step on the path to production.
Step 5: Build the Production Pipeline

Create a zone with the name Production Pipeline. Using a zone simply helps keep this pipeline distinct from others we have created. In Dataiku DSS, pipelines are chains of steps for processing data. The production pipeline is very similar to the scoring pipeline we built in Step 3, but it’s set up to score videos from a separate folder when it is triggered from a Dataiku scenario. Later we will set up an API endpoint and app to populate this folder and trigger the scoring.
A: Extract Frames
We need a simplified version of the frame extraction recipe that we used earlier. It won’t be as complex due to the fact that we don’t need any training/testing data; we’re just going to score videos (make an emotion prediction) and return the score.
To do that, we need to create a Python recipe. For input, create a new folder called Videos to Score, and create a new folder called Images to Score for the output.
Enter the following code for that recipe:
# -*- coding: utf-8 -*-
import dataiku
import pandas as pd, numpy as np
from dataiku import pandasutils as pdu

from custom_video_processing import extract_frame

# Read recipe inputs -- CHANGE THIS IDENTIFIER TO MATCH YOUR INPUT FOLDER
videos_to_Score = dataiku.Folder("MzP4vBYB")
videos_to_Score_info = videos_to_Score.get_info()

# Write recipe outputs -- CHANGE THIS IDENTIFIER TO MATCH YOUR OUTPUT FOLDER
images_to_Score = dataiku.Folder("wTpdvuPd")
images_to_Score_info = images_to_Score.get_info()

df = pd.DataFrame()
df['video_path'] = videos_to_Score.list_paths_in_partition()

frames = range(0,105,5)

new_df = []

for index, item in df.iterrows():
    for f in frames:
        item['frame'] = f
        item['image_path'] = item.video_path.replace('.mp4', '_f{}.png'.format(str(f).zfill(3)))

        new_df.append(item.copy())

df = pd.DataFrame(new_df).reset_index(drop=True)

for index, row in df.iterrows():
    _, frame_data = extract_frame(row.video_path, videos_to_Score,
                               row.frame)

    images_to_Score.upload_data(row.image_path, frame_data)
This code will read the videos and extract frames. We don’t need a dataframe to store metadata because the image path contains all we need.
B: Create the Scoring Recipe
Go to the Dataiku deep learning for images plugin. Click on Image Classification.

Set input to Images to Score and the new output dataset name to ProdScoredImages.
Make sure that the recipe is set to output all of the class labels regardless of their score. In other cases, these controls can help filter the output of your model or API.

Run the recipe. Your ScoredImages file should look like this:
![]()
C: Create Data Manipulation Recipes
For the rest of the production pipeline we need data processing recipes similar to the ones from Step 3.
Create the Prepare Data Recipe
Create a Prepare Data recipe using ProdScoredImages as the input and a new dataset ProdScoredImages_prepared as the output.
The prediction values output by the classification model are nested. To unpack those values, add an Unnest step:

With the predictions un-nested, we can remove the original prediction columns. Add a Remove Columns step:

Add a Replace step to rebuild the video name by using a regular expression to replace the frame identifier and file extension with the original video file extension:

Add an Extract step to extract the frame number from the file name. We’ll use the individual frame-level scores later.

Your output dataset should look like this:

Create the Group Recipe
The model will output predictions for each frame. We need to group the frames together to get a prediction for the video as a whole. Using ProdScoredImages_prepared as the input and a new dataset called ProdScoredVideos as the output, create a Group recipe to combine the scores for each video:

In this pipeline we just take the average prediction scores, which is approximately equal to the maximum occurrence approach from before.
Step 6: Visualize and Automate Production Scoring
We have now created our processing pipeline to create emotion predictions for an arbitrary image. This pipeline can now be used to build visualizations and automate scoring. In this step, we will create a dashboard that displays model predictions through a series of charts.
A: Create visualizations
To display the classification results, first we create the insights that will go on our dashboard.
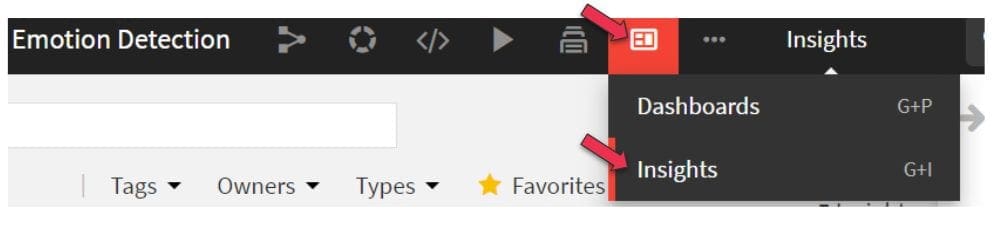
On the Insights page, select New Insight and create a new chart.

Select our ProdScoredVideos dataset.

In the newly created insight, select Summary and rename the chart to Emotional Composition.


Select Edit. We will create a bar chart with video_path on the Y axis and then the all of the prediction fields on the X axis. This will show us the breakdown of each video.

To get a deeper analysis, we can examine the emotional content of the video over time by looking at the scores for each frame. Create a new insight called Emotional Detail and select the ProdScoredImages_prepared dataset. Select Stacked Area 100% as the type.
The Y axis here will be the same as before (all the prediction variables), but this time the X axis will be the frame1 field, and we want to add video_path to the Subcharts section. This will show us the emotion score of each frame of each video, giving us a timeline of emotion within the videos.

To display these insights, create a new dashboard (1), go to the add button (2), select Chart (3), and select an existing insight (4).

(1) Create a new dashboard

(2) Go to the add button

(3) Select Chart

(4) Select an existing insight
Now we have a dashboard that can be used to interpret model output. We’ll reference this dashboard later when we build an Application.
B: Create a Scoring Scenario
We need to create a Scenario to move images around for scoring. Create a new scenario from the project menu named Score incoming videos with the id PRODSCOREVIDEOS.

(1) Go to Scenarios

(2) Select New Scenario

(3) Name them accordingly
We want this scenario to do everything needed to score a new batch of videos that have been placed in the Videos to Score folder, which includes clearing out the old results.
From the Add Step menu, add a Clear step to remove all of the previously calculated datasets:

Add four Build steps to calculate the new results. You could combine these all into one step, but it’s a bit easier to monitor and debug if they are separate steps.

Build step for Images to Score folder

Build step for ProdScoredImages folder

Build step for ProdScoredImages_prepared folder

Build step for ProdScoredVideos folder
Add a Refresh statistics & chart cache step to make sure that our dashboard gets recreated.

Finally, add a Clear step to delete all of the video and image files so that we’re ready for the next scoring run.

Combined with the Dashboard, this scoring Scenario will allow us to process uploaded images and produce interpretable visualizations. Later, we’ll plug this into an Application to expose this power to users.
Step 6: Deploy the API
With model Pipeline and Dashboard created, we can now expose this functionality as an API. The API will eventually be called by the Application in the final step.
A: Create API Keys for Scenario Execution
To create our API, we will create an endpoint that accepts a video upload, places it in the Videos to Score folder, triggers execution of the scoring scenario, and returns the results. To do this, we’ll need an API key that can be used to remotely interact with the DSS server from the API endpoint.
To create an API key, open up your user settings, go to the API keys page, and select New API Key. This will create a key that you can use to perform actions as your user. Keep this key secret. This key should be treated like a password because it grants the same level of access.

(1) open the user menu
(2) Open user settings

(3) Select New API Key
You should now see an API key listed. Record that value for later.

B: Create the API Endpoint
The next step is to create an API endpoint in the API Designer pane.

We must create an API service, to which we can add an endpoint.


With the service created, we can now add an endpoint. Click the Create Your First Endpoint button.

Selecting the Endpoint type of <Custom Prediction (Python) will let us enter Python code to generate the prediction.
Enter the following code with a few modifications. The folder ID ‘MzP4vBYB’ needs to be changed to match the ID of your Videos To Score folder, the URL and API key for the remote DSS server need to be changed to your hostname and key, and the project key needs to match your project.
from  dataiku.apinode.predict.predictor import ClassificationPredictor
import dataiku
import base64
import pandas as pd
class MyPredictor(ClassificationPredictor):
    def __init__(self, data_folder = None):
        self.data_folder = data_folder

    def predict(self, features_df):
        dataiku.set_remote_dss('https://dataikuworker1.valhalla.phdata.io:11200', '2j9dLyBKEOhnVyxIiihoMhyhRwAReWpz')

        df = features_df
        data_folder = dataiku.Folder('MzP4vBYB', project_key='AWSDEVDAYEMOTIONDETECTION')

        for ind, row in df.iterrows():
            fname = 'ind_{}.mp4'.format(ind)

            df.loc[ind, 'fname'] = fname
            data_folder.upload_data(fname, base64.urlsafe_b64decode(row.b64_video.encode('utf-8')))

        client = dataiku.api_client()
        project = client.get_project('AWSDEVDAYEMOTIONDETECTION')
        scenario = project.get_scenario('PRODSCOREVIDEOS')

        scenario_run = scenario.run_and_wait()
        success = scenario_run.get_info()['result']['outcome'] == 'SUCCESS'

        ds = project.get_dataset('ProdScoredVideos')
        scores = pd.DataFrame(data=list(ds.iter_rows()),
                              columns=[c['name'] for c in ds.get_schema()['columns']])
        scores = scores.set_index('video_path')


        emotions = ['calm', 'sad', 'surprised', 'neutral',
            'fearful', 'angry', 'happy', 'disgust']

        df = df.drop(columns=['b64_video']).join(scores, on='fname')

        for ind, row in df.iterrows():
            max_val = 0
            max_label = None
            sum_val = 0

            for e in emotions:
                p = row['prediction_{}_avg'.format(e)]
                sum_val += p
                if p > max_val:
                    max_val = p
                    max_label = e

            df.loc[ind, 'prediction'] = max_label

            for e in emotions:
                df.loc[ind, 'proba_{}'.format(e)] = row['prediction_{}_avg'.format(e)] / sum_val

        decisions = df.prediction
        proba_df = df[['proba_{}'.format(e) for e in emotions]]

        return (decisions, proba_df)
In a nutshell, this code accepts a dataframe of observations. Each observation has a feature called b64_video, which is a base-64 encoded video file. The video file is uploaded to the scoring folder, and then the scoring scenario is run. After that scenario completes, the ProdScoredVideos dataset is read and the results are translated into the appropriate response format.
C: Deploy the Endpoint
First, we want to set the endpoint so that it uses key-based security and isn’t open to the whole world. Go to the Security menu, uncheck the box marked “Allow public access”, and generate an API key.
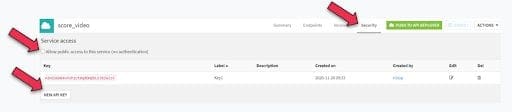
You’ll need this key to access the service.
Now, push the endpoint to the API deployer and give it a version ID.


There will be a popup that lets you go to the API Deployer, but you can get to it through the main menu if you miss it.


In the API Deployer, you should see your service in the Available for deployments section.

Select deploy. You’ll need to select your API Infrastructure (setting that up is outside the scope of this document). Select Deploy, then Start Now.


After deployment is complete, you should now see a summary of the service.

You can go to the Sample code section and see some detail for how to invoke this API from different languages. Of particular relevance is the Python example:

We didn’t supply any test queries, so the record format is incorrect, but this demonstrates the basic API.
D: Test the Endpoint using a Jupyter Notebook
To test this endpoint, we’ll create a Jupyter notebook to access it. From the project menu, open the Notebooks section and create a new Python notebook. The starter code selection does not matter – we’ll delete it anyway.

(1) Open the Notebooks section

(2) Create a new Python Notebook

(3) Select any starter code
This notebook will grab a few videos randomly, then call our scoring API. This code sets up the environment:
from tempfile import mkstemp
import os
import base64

import dataiku
import dataikuapi

import pandas as pd

client = dataikuapi.APINodeClient("https://dataikuworker1.valhalla.phdata.io:11220",
                                  "score_video", "A2HZU6HB4vPoh1Ut0qRDHpbLG3bZwIzP")

EMOTION_MAP = {'01': 'neutral', '02': 'calm', '03': 'happy', '04': 'sad',
              '05': 'angry', '06': 'fearful', '07': 'disgust', '08': 'surprised'}

def get_emotion(fname):
    code = fname.split('-')[2]
    return EMOTION_MAP.get(code, 'unknown')
Now we grab a few videos. Note that we can directly use the Dataiku API without a key because we are running this directly on the DSS server.
# Change the below key to match your Emotion Videos folder
emotion_videos = dataiku.Folder("JV4cw0cu")
emotion_videos_info = emotion_videos.get_info()

df = pd.DataFrame()
df['video_path'] = emotion_videos.list_paths_in_partition()
df['emotion'] = df.video_path.apply(get_emotion)

df = df.sample(5)
df
We should see the randomly selected videos:

Now, we do a few things simultaneously. We will use the Dataiku Folder API to download the selected video files, then we will use the base64 package to encode the videos and build a features dataframe.
records = []

for ind, row in df.iterrows():
    video_path, video_folder = row.video_path, emotion_videos
    vf, vfname = mkstemp(suffix='.mp4')
    vfile = os.fdopen(vf, 'wb')

    p = video_path
    with video_folder.get_download_stream(p) as stream:
        vfile.write(stream.read())
    vfile.close()

    with open(vfname, 'rb') as f:
        b64f = base64.urlsafe_b64encode(f.read())

    records.append( {'features': {
        'file_name': row.video_path[1:],
        'b64_video': b64f.decode('utf-8')
    }})
Finally, to actually upload and score the videos, we use the client API and pass in our records.
predictions = client.predict_records('prod_score_video', records)
This will trigger the predictor class we made earlier. You should see a notification in the lower right corner showing you the progress of the scenario:


Now, the predictions variable holds the API response:

You can combine these predictions with the original labels to see if the prediction was correct:

We now have a working API endpoint!
Step 7: Build an App
To share this project as an app, we can use the Application Designer.

Create a new visual application.

You can select all of the information that gets copied with your application. For this project, the only information that is really needed is the trained neural network and the datasets/folders in the production pipeline. Add that folder to the included content.

Next we need to add the functionality to the app. Select Add Section, and specify a name for your app.


Now we need to add tiles to allow users to upload video files, trigger the scoring scenario, and view or download the results. This is really where all of the components we have developed so far get stitched together.

Once the tiles have been added, you can test the application:
![]()
You should see your app interface:

Test it out by dropping a video file into the upload area (you can manually download one from your video folder if needed), selecting Run Now and then looking at the dashboard.

Now that the app is complete, you can instantiate a new instance from the main Dataiku screen.

When a user selects that, they are prompted to create their own copy of the application.


Once a user has instantiated their own app project, they are operating in a completely different environment than the original Dataiku project. They cannot accidentally interfere with the original work or with any other apps that have been created.
You can also create a plugin application from the application designer. This allows you to distribute the plugin as a standalone file that can be installed into an entirely separate Dataiku instance.


Conclusion
In this walkthrough, we created a fully functional system for processing video using deep learning and extracting emotional classifications. This can serve as an excellent starting point for further work, or as a template to be reused for other projects.
The same technique we’ve used here for emotion video classification can be applied to many different video classification tasks, from determining if retail customers in surveillance footage are enjoying themselves to identifying defective parts on a manufacturing line.
Looking for more ideas about how you can use cutting-edge tools to advance your business or deep learning consulting for your advanced machine learning projects? Reach out to us at info@phData.io to talk about your projects in more depth!


