This Citizen Service Request (CSR) Tableau Dashboard example allows local and state government departments to gain insight into the submitted open CSRs and to help the departments better understand how to allocate resources to address the requests. Additionally, it gives information about previous CSRs to gain insight into how departments are performing when addressing these requests.
This dashboard is powered by the Snowflake Data Cloud. Learn more about Snowflake’s offerings here.
Who is the Ideal User of This Dashboard?
This dashboard is designed for local and state government leaders to view each of the departments to understand how the key performance indicators for the department are trending. It allows users to understand the number of requests that are open and closed by each department and go one level deeper to the sub-department level.
What You Can Accomplish With Dashboard
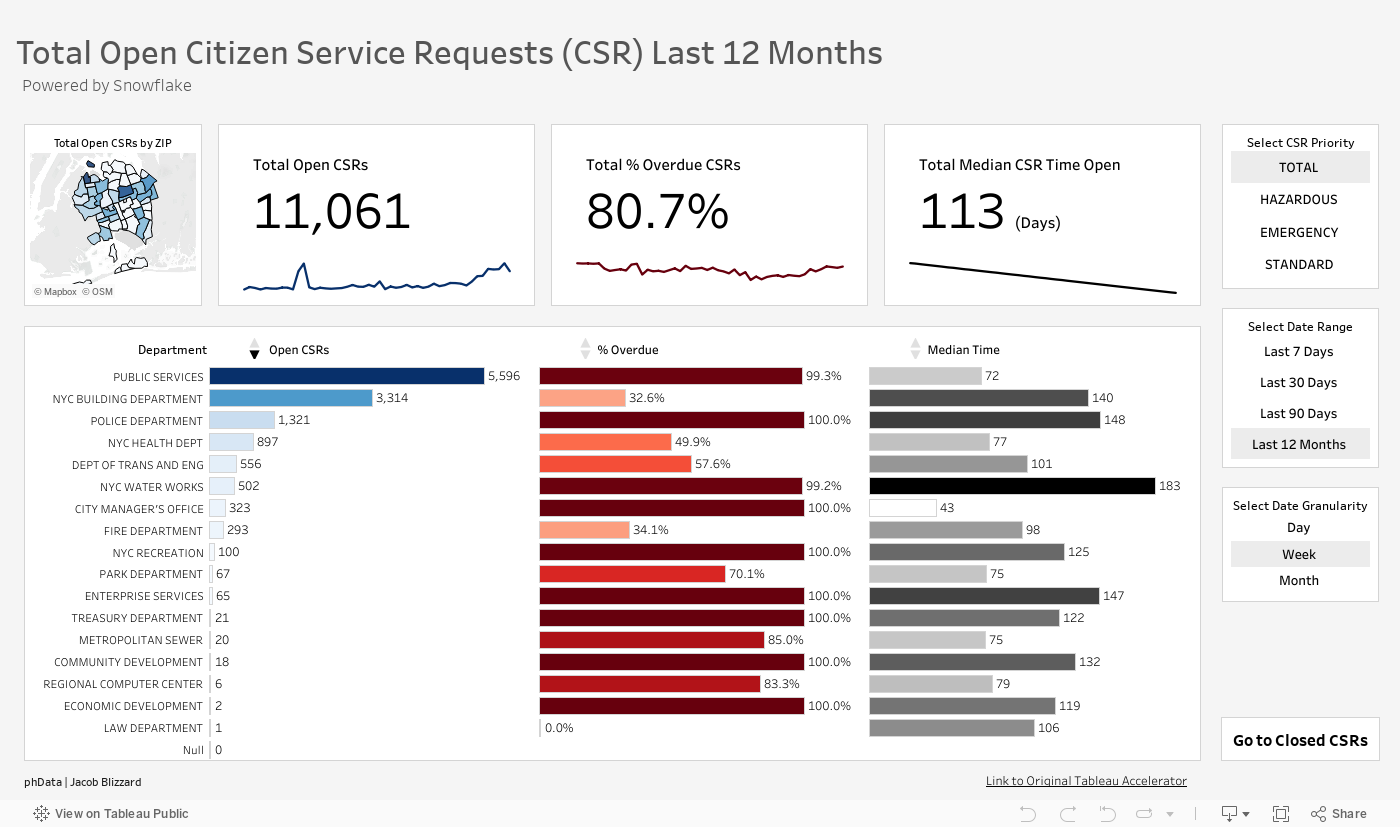
The Open CSR & Closed CSR dashboards allow you to quickly identify which department has the most open & closed CSRs during a particular time period selected by the user. There are additional metrics that let users know the percentage of overdue CSRs for each department as well as the median time that each CSR is open/until the CSR is closed. Some questions you can answer by using this Tableau Dashboard are:
Which department has the most open CSRs?
Which department has the highest percentage of overdue CSRs?
Which department takes the longest median time to close CSRs?
Which department has closed the most CSRs?
How have these metrics trended over time?
How are sub-departments performing with each metric?
Which ZIP code has the most opened & closed CSRs?
What is the period over period percentage change for Closed CSRs?
The users of this dashboard can change the CSR Priority, the date range, and the date granularity of the trending chart. The different priorities are Total, Hazardous, Emergency, & Standard. The users can select whether to show the last seven days, last 30 days, last 90 days, and the last 12 months. Finally, the user can toggle the granularity of the trending charts to show the data by day, week, or month.
Conclusion
We hope that you found this dashboard useful in your journey to understand the trends of Citizen Service Requests at a local and state governmental level.
If you have any questions, need help, or are interested in having a team of Tableau experts design dashboards for you, feel free to reach out!