July 14, 2020

How to Build a Pivot Table in Tableau

By Katrina Menne

Microsoft Excel will always hold a special place in my heart. Learning how to automate excel through VBA is what made me interested in coding and eventually lead me to Tableau.  A common struggle for Tableau users is recreating specific elements of Excel, especially the drill-down functionality of a Pivot Table.

Before we talk about how to recreate a Pivot Table, we first should discuss why we are recreating one. A request to make a Pivot Table in Tableau can be a great time to push back and determine the true needs of the end-user.  Sometimes the request is made purely because the design is familiar. You can use this case to gently push users into the wonderful world of Tableau.

However, analytics does not live in a Tableau bubble.  Most of us will encounter projects that involve some Excel fans.  In those cases, here are some options for mimicking a Pivot Table.  Each option has different pros and cons so it’ll be up to you to figure out which option is best for your users, your Tableau developers, and your data.

Option 1: Built-In Hierarchy

  • Design Difficulty: Easy
  • End-User Friendliness: Medium
  • Similarity to Pivot Table: Medium

Link to Instructions: Tableau: Create Hierarchies

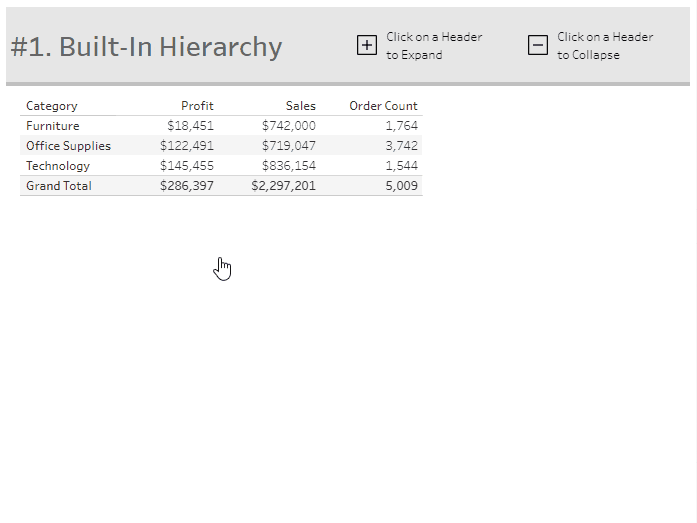
The easiest and quickest path to a Pivot Table in Tableau is to use the built-in Hierarchy functionality. To create a hierarchy, you simply drag the dimensions on top of each other. I strongly suggest starting here because it requires so little development time and provides a high level of familiarity with a Pivot Table.  It might be a good idea to pair this set up with filters because, depending on your data, the lower levels of drill-down might have a significant number of lines.

As always, directions are encouraged to help your end-user understand how to drill-down. Some end-users, might not know they need to hover over the field label to find the drill-down icons (+/-).

Option 2: Dynamic Drill-down

  • Design Difficulty: Medium
  • End-User Friendliness: High
  • Similarity to Pivot Table: Medium
Parameters can allow your end-user to select the order of drill-down. This can be great for people who are used to creating their own Pivot Tables and need flexibility in their data.  For example, a marketing team might be interested in a Category > Sub-Category > Region breakdown, whereas a sales team might want to see Region > Category > Sub-Category.

This can also be a great option if you’d like to limit the options of lower levels based on prior level selections or if you need to limit options based on usernames. Also, this opens the door for all of the cool UI functionality with parameters (ie custom buttons).

Option 3: Click to Drill-down

  • Design Difficulty: Medium-High
  • End-User Friendliness: High
  • Similarity to Pivot Table: High

The most common functionality people are trying to mimic from a Pivot Table is the click to drill down functionality. Click to investigate is arguably the most user-friendly option and helps to encourage Tableau’s “Click to Discover” mentality.  However, the built-in functionality (Set Actions) only allows for two levels of data (ie Category & Sub-Category, not Category, Sub-Category, and Manufacturer).

Using Parameter Actions and some display tricks, we can recreate the click to drill down functionality. This approach takes the most time out of the three, but in my opinion, it is the most similar to a Pivot Table.
Excel and Tableau are both great tools that have their own high and low notes. But with these options, we can take some of the advantages of both and make something great.

Check out the full Tableau workbook with the different Pivot Tables on Tableau Public: Pivot Table Options.

Data Coach is our premium analytics training program with one-on-one coaching from renowned experts.

Accelerate and automate your data projects with the phData Toolkit