

Once you’ve created an awesome Power BI report with an efficient and properly constructed data model, easy to understand visuals, and meaningful metrics using DAX, you need to be able to get that report into the hands of your desired end-users (and only those end-users). This is when you have to put down Power BI Desktop and navigate Power BI Service.
Power BI Service is the web based repository that enables you to publish and share your data and Power BI reports.
Power BI Service is made up of a few different elements such as Reports, Datasets, Workspaces, and Apps. In this blog post we are going to be walking through each of these items to better understand how everything works together to help deliver insights to end-users.
Power BI Service Navigation
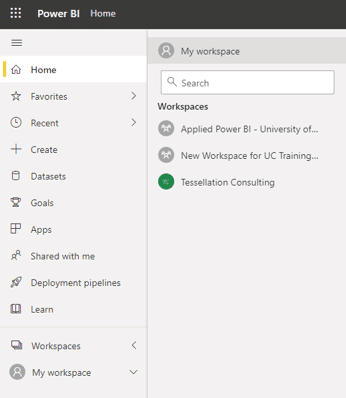
Before diving into the more specific topics for today, let’s review our Power BI Service interface and navigation. The screenshot below is an example of what may pop up when you navigate to PowerBI.com. You will be asked to authenticate to access the site which you can verify in the very top right of the page (person icon).

The Home view by default gives you a summary of your favorited or frequently visited content at the top. The bottom then gives you options to view recent content, content shared with you, and your apps.
On the left hand side, you will see a taskbar with several options to navigate to different views within Power BI Service.
- Favorite – Shows all of your favorited content (reports, dashboards, apps)
- Recent – Shows your most recent workspaces, reports, apps, or dashboards that you’ve visited.
- Create – quick link to being developing a report within Power BI Service using either manually entered data or a published dataset
- Datasets – list of all available datasets to you in Power BI Service
- Goals – a recently released feature that allows you to track certain metrics with this view in Power BI Service
- Apps – all of the workspace Apps that you have access to
- Share with me – all content that is shared with you by others in your tenant
- Deployment Pipelines (Premium) – visual interface used for promotion of reports and datasets between dev, test, and prod workspaces
- Learn – resources for Power BI training
- Workspaces – these are the workspaces that are available to the users
Workspaces
Perhaps the most important aspect of Power BI Service to be familiar with regardless of role is the concept of the Workspace. Workspaces are the primary way to organize content within Power BI Service. Workspaces are like folders that allow you to organize content and therefore end users into different areas. In the screenshot below you can see the different workspaces available in this Power BI instance.
When determining how to divvy up content into workspaces, there are a few different things that we need to take into consideration.
- What roles are the end users?
- What departments/organizations are the end users in?
- What data do the end users have access to?
You might want to divide up your workspaces by department since a lot of times different departments will have specific reports based on their business function. You might want to have different workspaces specifically for high level members of your organization so they can see all of the reports pertaining to their areas of coverage in one place. But regardless of how you divide them up, you need to make sure that people only gain access to data that they are entitled to see.
You can control the individual users or Active Directory (AD) groups that have access to each workspace using the Access button at the top right of the workspace.
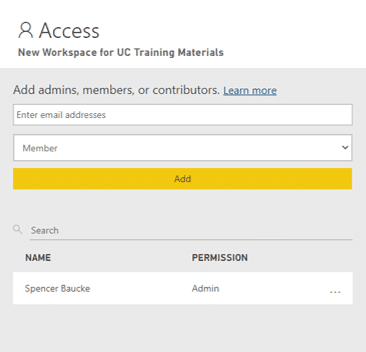
You can assign users of the workspace four different roles; Viewer, Contributor, Member, or Admin.
- Viewer – only capable of viewing content published to a workspace
- Contributor – capable of creating and editing content in a workspace
- Member – capable of editing dataset permissions as well as updating and publishing to the workspace App
- Admin – capable of all workspace functionality including adding and deleting users to/from the workspace
For more details you can check out the specific role capabilities here. Now that we’ve walked through basic navigation of Power BI Service and the workspaces within it, let’s talk through the content that is actually published onto the Service.
Published Content
When creating content to store on Power BI service, you will generally create one of the four types of content; Report, Dashboard, Dataset, or Dataflow. The list below shows you the icon that appears in Power BI Service as well as a description of each item.

Report
The visuals that you publish for end users to consume on Power BI Service. You can create Reports in both Power BI Desktop and Power BI Service. A Power BI Report refers to what many in the industry refer to as a “dashboard”.

Dashboard
A collection of visuals pinned to one location from different reports within a single workspace. You can also customize Dashboards with text and images. A dashboard is often used to understand bigger picture stories happening across multiple reports.

Dataset
The data that is being used by published reports. The dataset gets published to Service as well when a report is published. It should be noted that Power BI Desktop can connect to datasets already published to Power BI Service as well. In this instance, there is no new dataset published to Service when the report is published

Dataflow
A dataset that is created within Power BI Service for use by report producers. Data can be combined from multiple sources and transformed in a variety of ways to create a dataset that can be accessed similarly to a previously published Power BI dataset.
You can see the example workspace below with examples of different content types.

The last part of published content that you will want to know about is the Workspace App. This App serves as a sort of wrapper for the content that is found within each workspace. As you can see in the screenshot above, you can control what content from your workspace is displayed in the App.
The screenshot below gives you an idea of what a Workspace App looks like for end users. Apps are a nice way of organizing content as the link to your Apps won’t change providing for a consistent navigation experience for stakeholders. You can also grant access to the App instead of the entire workspace which provides another level of data governance.

In Conclusion
Developing solid reports is crucial for an effective reporting environment, but understanding how to disseminate those reports efficiently is just as important. When using Power BI, you will need to understand how to use datasets and dataflows to build reports as well as dashboards(from those reports) in your workspaces to put in your App.
Hopefully, this blog has been helpful in guiding you through the basics of Power BI Service. Just know that there are a lot more intricacies in gaining a more advanced understanding of its operation, but this blog should give you a good start on that.
Have more Power BI questions? Our team of Power BI experts are here to help!


