This Tableau shipment dashboard gives users the ability to track key shipment and delivery metrics and compare current performance to relevant historical periods.
A second view allows for exploration into shipments in transit (shipments that have not yet been delivered), in order to take action on potential lost shipments, and/or mitigate any potential complaints from upset customers.
A third view allows the user to see performance metrics and statistics by shipping organization and recipient country.
Who is the Ideal User of This Dashboard?
This Tableau shipment dashboard is designed for a COO and/or Operations Managers who want to track shipping performance across shipping organizations and by recipient country/organization. This shipment dashboard will also help stakeholders resolve any ongoing shipping issues as well as target certain geographies for improvement.
3 Things You Can Accomplish With This Shipment Dashboard
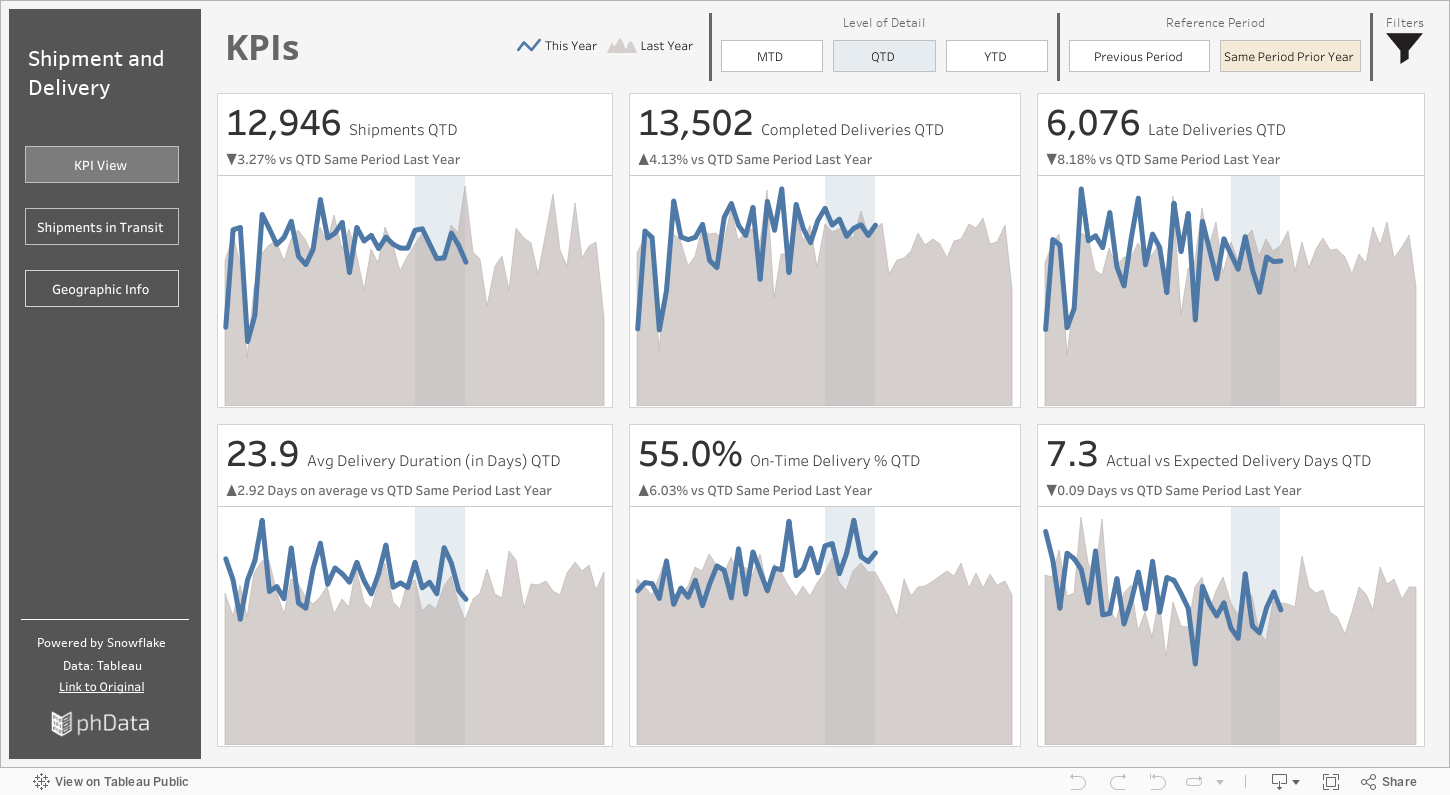
1. KPI View
Level of Detail Buttons: Clicking through these buttons will change the frame of reference for the six key metric call-outs. The year-over-year charts will also update to show which timeframe is in focus.
Reference Period Buttons: Clicking between these two buttons will change the frame of reference in which the key metrics are compared to. For example, if ‘QTD’ is selected in the Level of Detail, and ‘Previous Period’ is selected for the Reference period, the up/down arrows below each call-out will show how the current quarter to date is compared to the previous quarter to date. When ‘Same Period Prior Year’ is selected, it will compare the current quarter to date with the same quarter to date last year.
Filters: Clicking the filter icon will bring up a filter container where end users can apply filters to the entire dashboard (to all other views as well). When finished, clicking the ‘X’ hides the filter container again.
2. Shipments in Transit
Table Sort: The table on the right-hand side of the Tableau dashboard has arrows next to each column header to sort the recipient list by each metric in either ascending or descending order. When a new metric is selected as the sorting column, the bars will also change color, and labels are added to indicate that is the column being sorted. All labels can be shown at any time by clicking the ‘Show All Labels?’ button.
Viz in Tooltip: Hovering over the ‘Shipments in Transit’ column of the Recipient table shows the top 15 oldest shipments for each recipient.
Filters: Clicking the filter icon will bring up a filter container where end users can apply filters to the entire dashboard (to all other views as well). When finished, clicking the ‘X’ hides the filter container again. The left-hand charts can also quickly be filtered by the recipient when clicking on the recipient name or any of their bars in the Recipient table.
3. Geographic Information
Fact/Metric Selection: The key fact displayed on the two left-hand charts can be adjusted to show five different facts. Likewise, the key metric on the two right-hand charts can be adjusted to show four different performance metrics.
Filters: Clicking the filter icon will bring up a filter container where end users can apply filters to the entire dashboard (to all other views as well). When finished, clicking the ‘X’ hides the filter container again. The date frame of reference can also be changed by clicking the MTD, QTD, and YTD buttons.
Note that depending on the fact or performance metric selected, the data may be filtered by either shipment date or delivery date, whichever is most relevant.
Conclusion
We hope you found this Tableau shipment dashboard example useful in tracking key shipping performance indicators, identifying problem shipments, and segmenting the data by shipping organization and recipient country.