Sigma Data App Use Case: Negative Margin Analysis with Input Tables
By Sippy Rai
Identifying sales orders with negative margins is easy, but understanding why they occur is much harder. Most BI tools can highlight profitability issues, but very few support collecting context-rich feedback directly from business users in real time.
At phData, we recently developed a Sales Order-Level Margin Commentary Data App using Sigma Input Tables, which was also showcased at a recent Sigma data apps conference. This solution helps organizations go beyond traditional reporting by enabling teams to:
Enter order-specific reasons for negative margins directly within a dashboard
Track commentary status and reason across key business dimensions
Receive automated reminders for pending commentary
In this blog, we’ll discuss how the solution works and how your team can leverage Sigma’s interactive features to build a more collaborative and actionable margin analysis workflow.
Why Negative Margin Analysis Matters
Negative margins can quietly erode profitability if not identified and addressed promptly. These margin losses may be driven by:
Incorrect discounting or price overrides
Delayed or expedited shipping
Damaged or returned products
Inventory mismatches
Promotional pricing issues
While dashboards can highlight the what, the why often lies with frontline teams—sales reps, store managers, or supply chain personnel. Bridging this gap requires a tool that enables real-time, order-level input from across the business.
Building the Solution in Sigma
Step 1: Connecting the Data
We begin by connecting to the Sigma Sample Database, which is linked to a Snowflake AI Data Cloud instance containing sample sales order data. From here, we calculated profit margin at the sales order level and flagged all orders with negative margins.
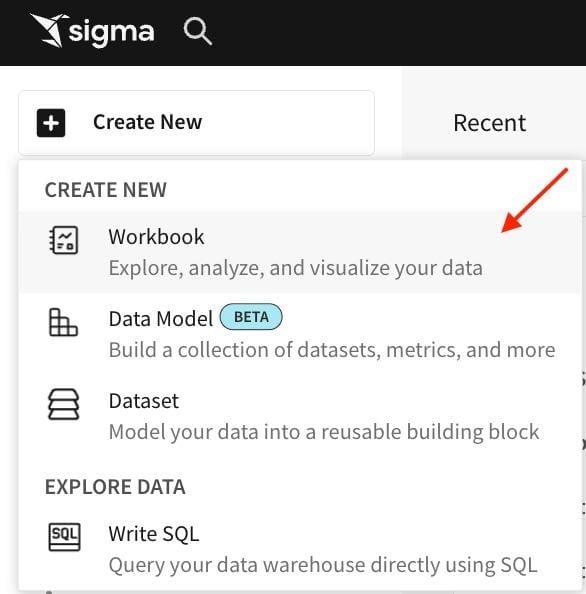
Log in to your Sigma Environment. Create a new workbook.
Connect to the data source table to get sample orders.
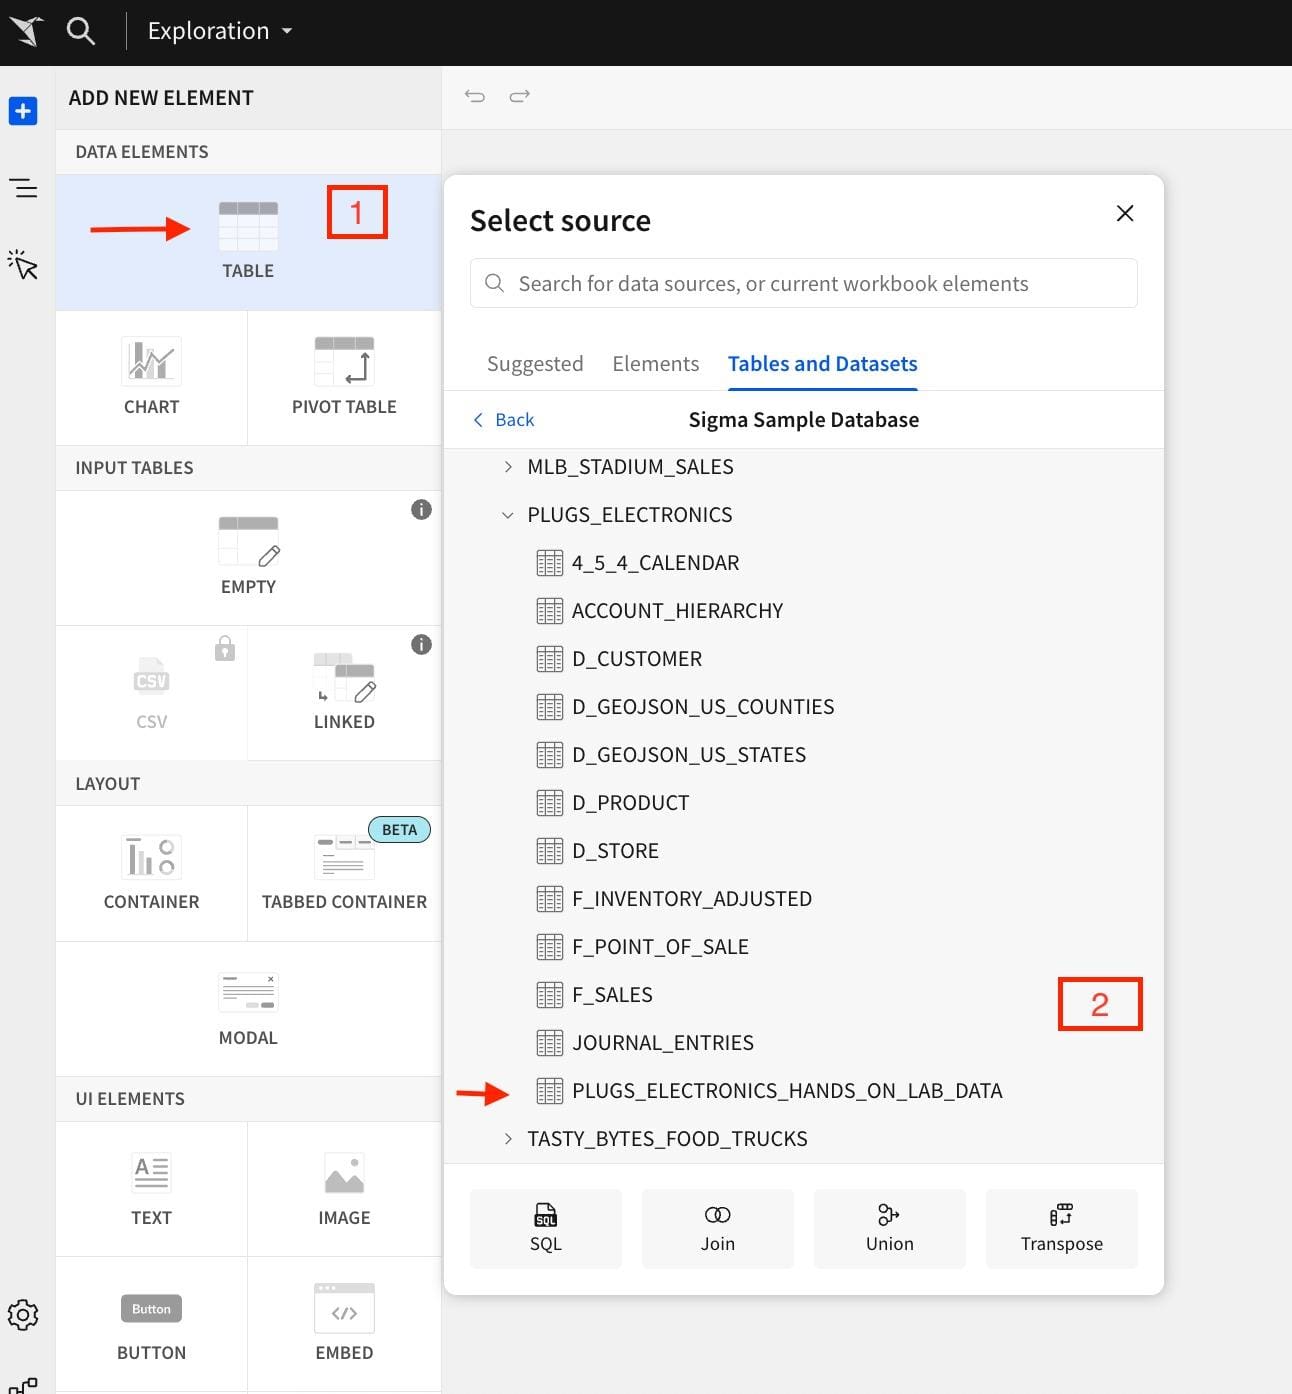
Click on the Table element. Select table PLUGS_ELECTRONICS_HANDS_ON_LAB_DATA
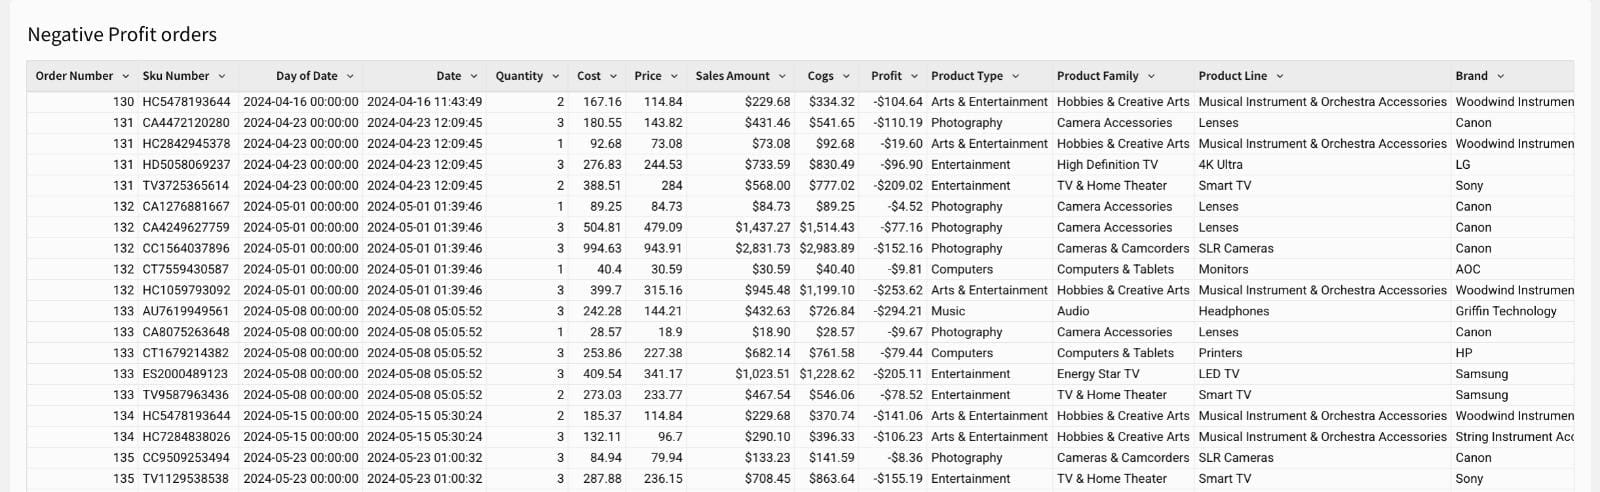
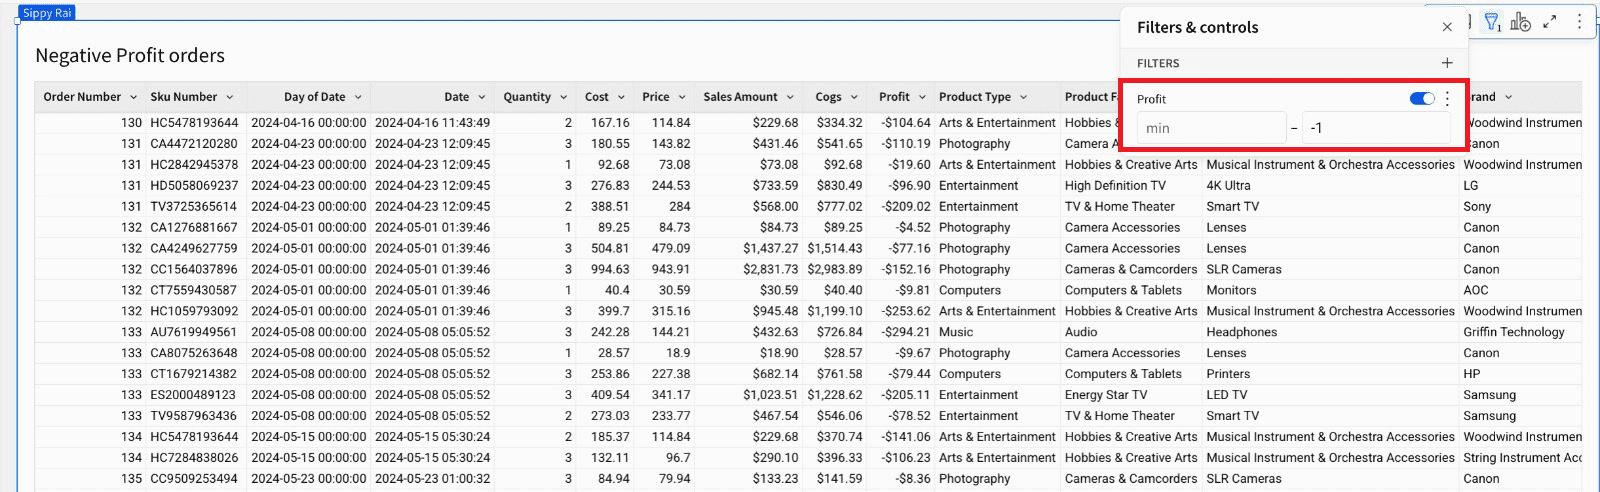
The table will display detailed records of orders. Apply a filter on the Profit column to only show rows with negative values.
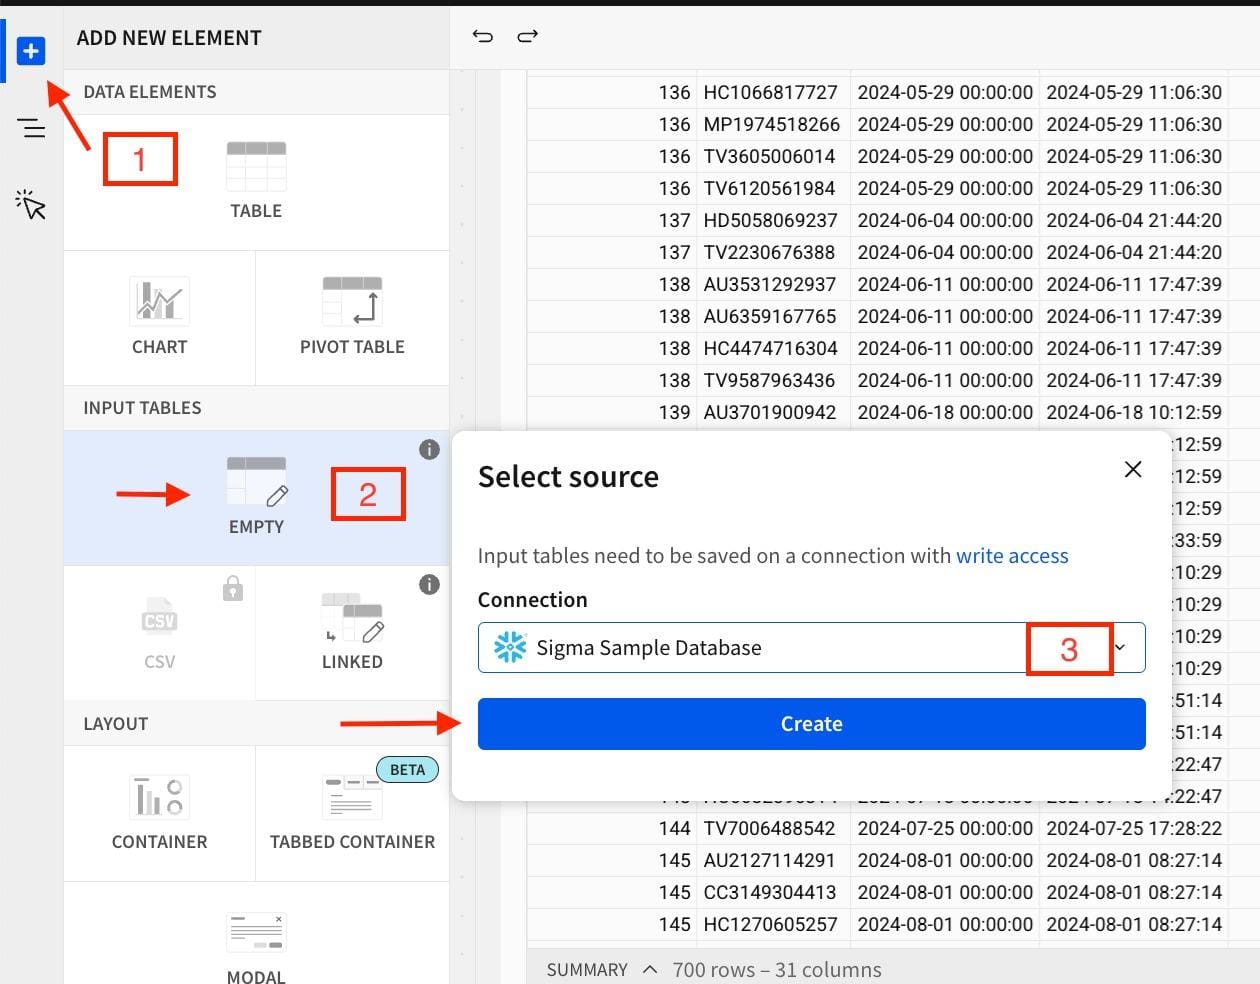
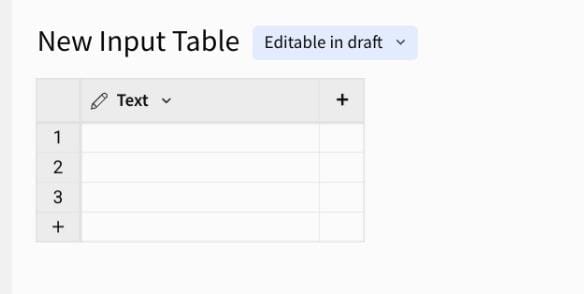
Next, prepare a list of possible reasons for users to select when entering commentary. For this, create an empty Input Table and add a few predefined reasons as shown below.
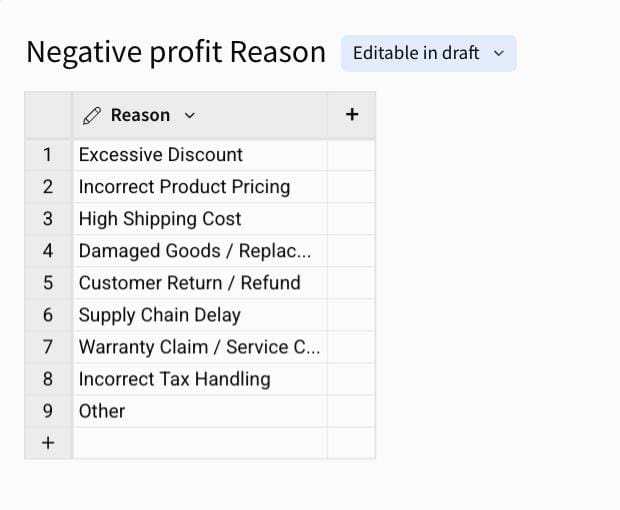
Enter or paste the list of possible reasons. Rename the table and columns as per the screenshot below.
Step 2: Capturing Commentary with Input Tables
Sigma’s input tables are central to our solution. These tables allow users to enter data directly into dashboards, enabling two-way interaction between users and the BI platform.
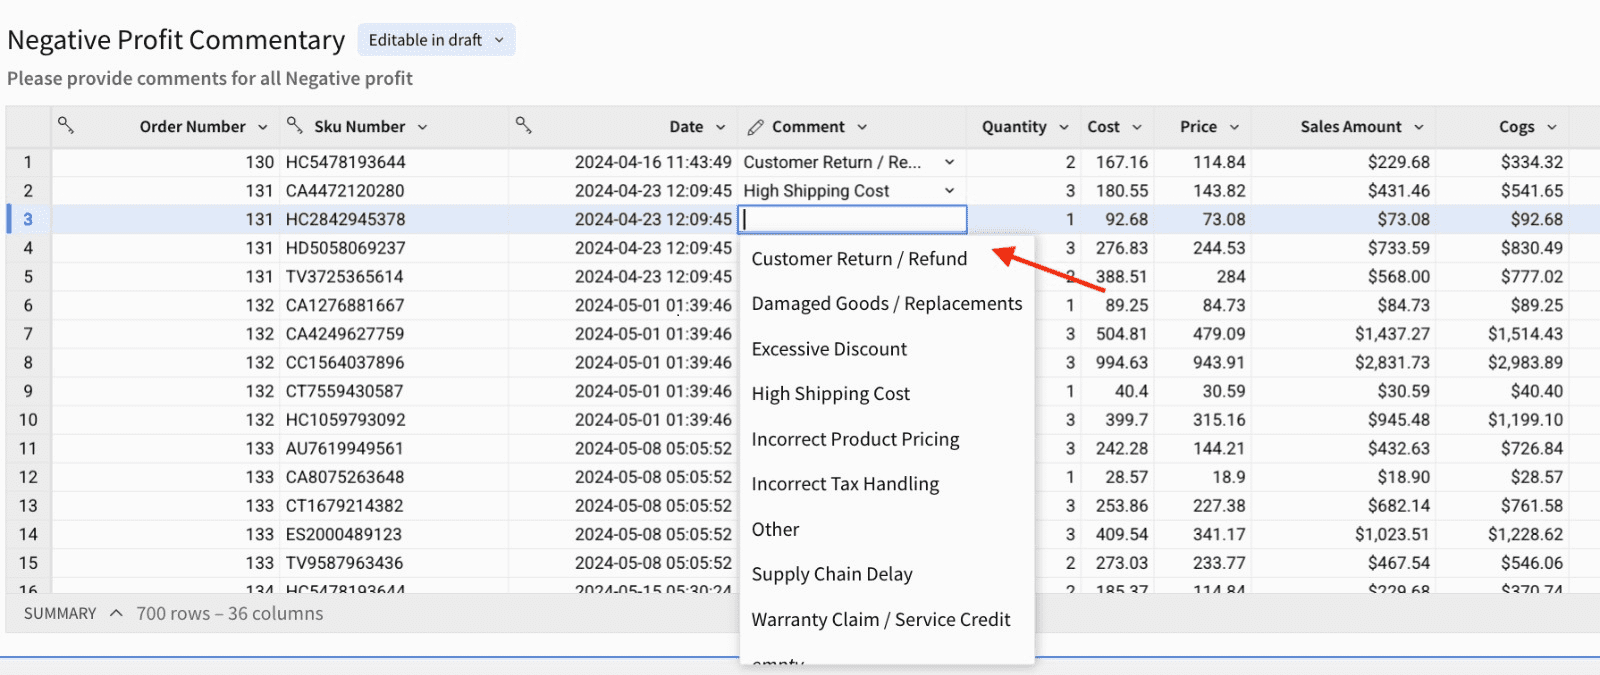
For each order with a negative profit, users could input a predefined reason (e.g., Excessive Discount, High Shipping Cost, Customer Return/Refund, Supply Chain Delay, etc.) in the Sigma table.
This interactive input eliminates the need for back-and-forth over emails or spreadsheets and enables a scalable, collaborative approach to root-cause analysis. Below are the further steps
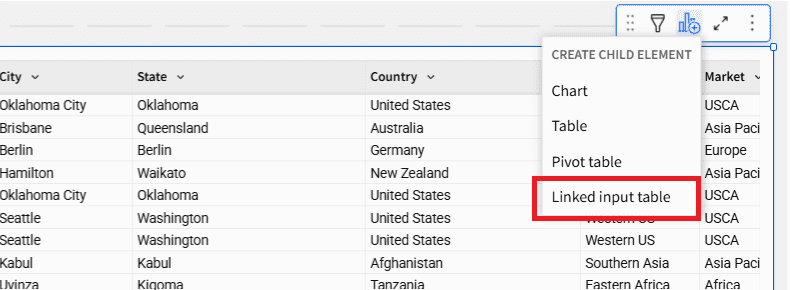
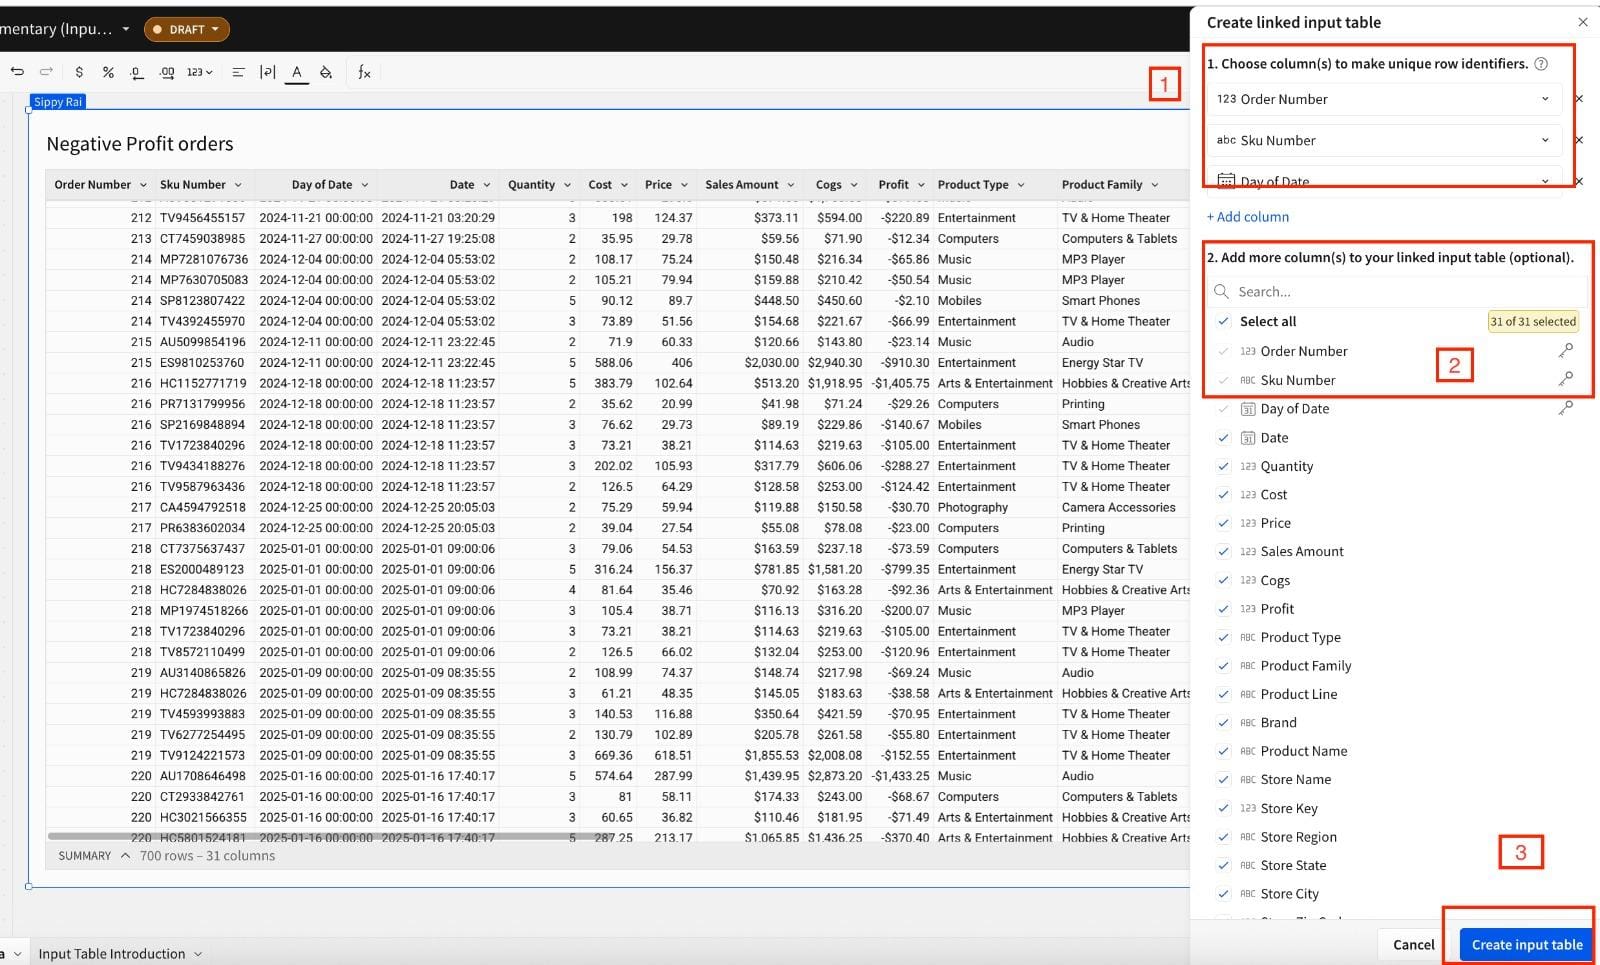
Create a linked input table on the Negative profit Orders table created above.
From the right corner of the table, select Create Child Element and then select Linked Input Table.
The Configuration panel will appear.
Select the columns that uniquely identify rows.
Select the columns you want in the input table.
Click on Create Input Table.
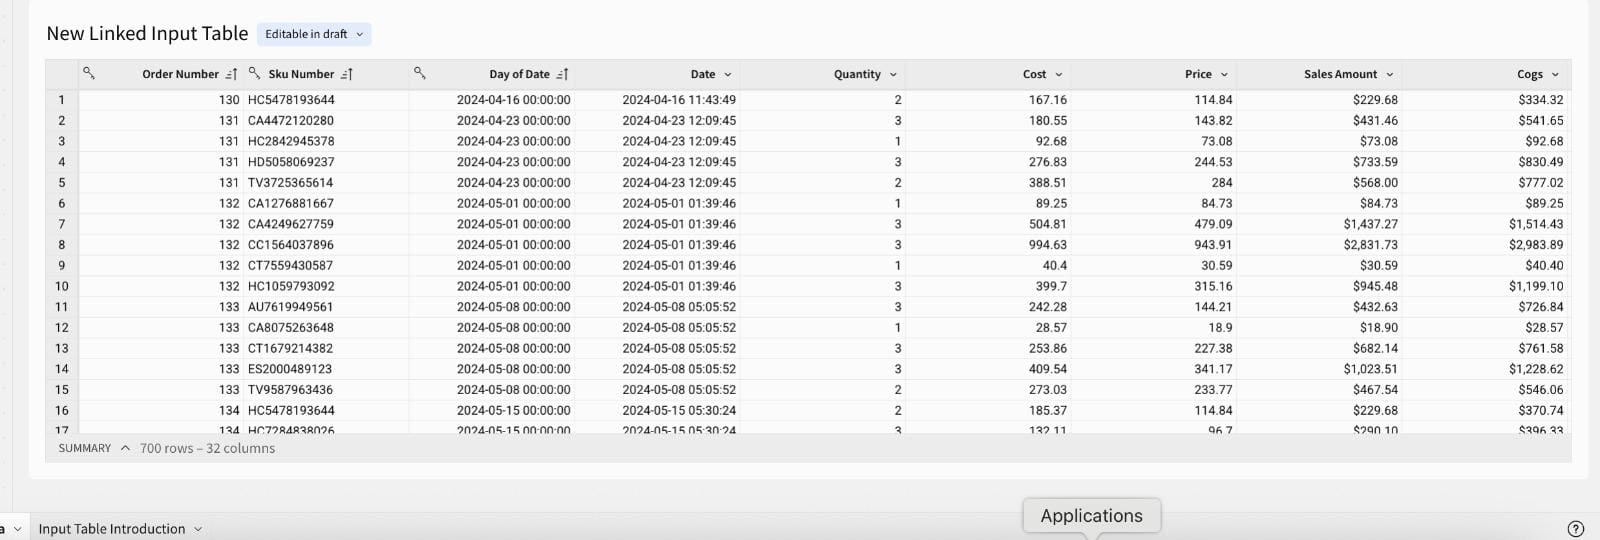
The following input table will be created. Rename title to “Negative profit Commentary”
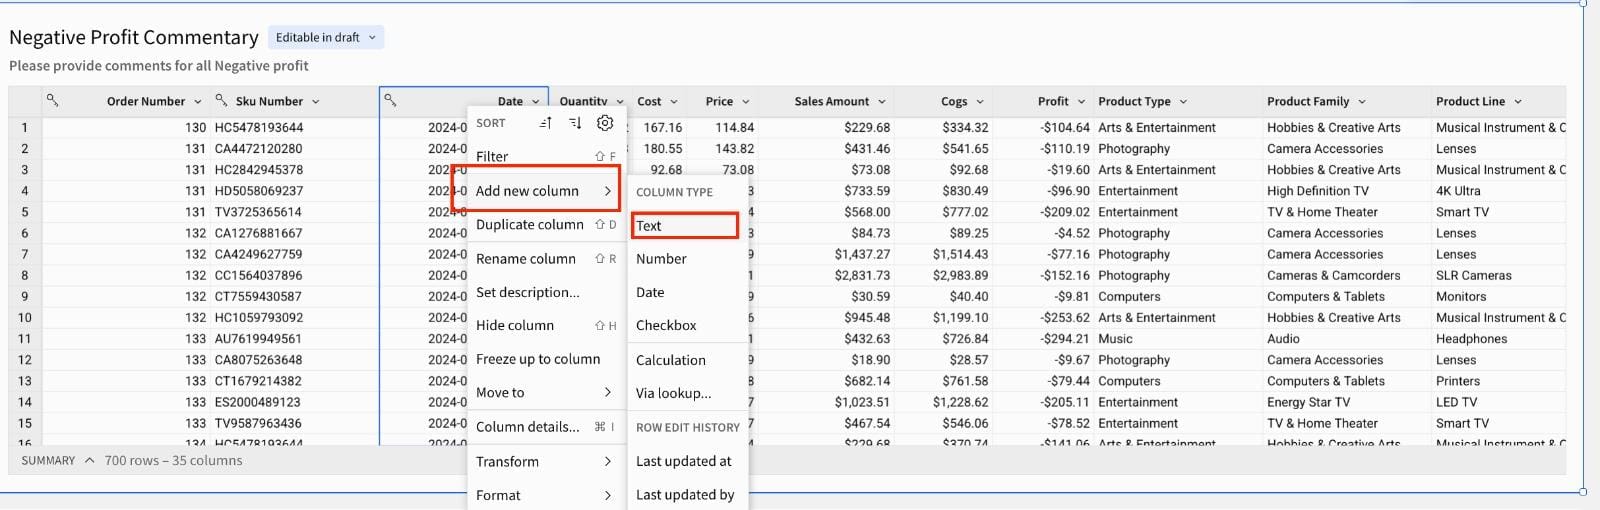
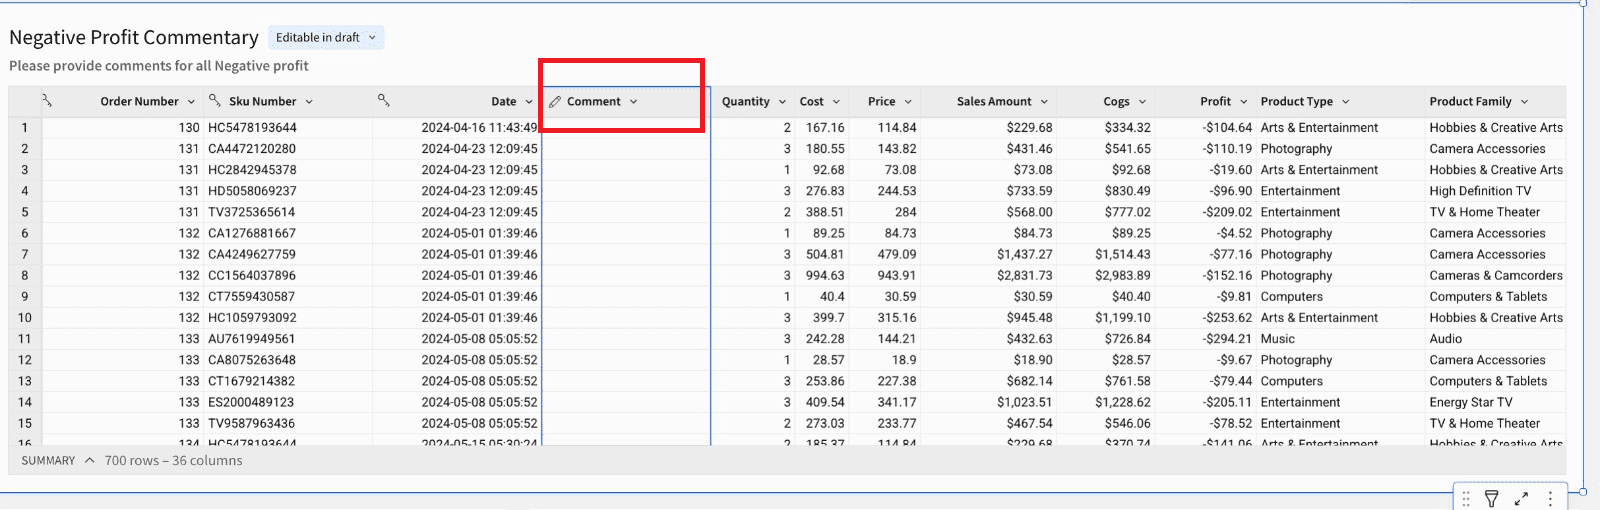
Now it’s time to add the input column Comment to the table where the user will provide inputs based on the dropdown selection. Right click on any column > Add New column > Text. This will create a new column with a pencil symbol.
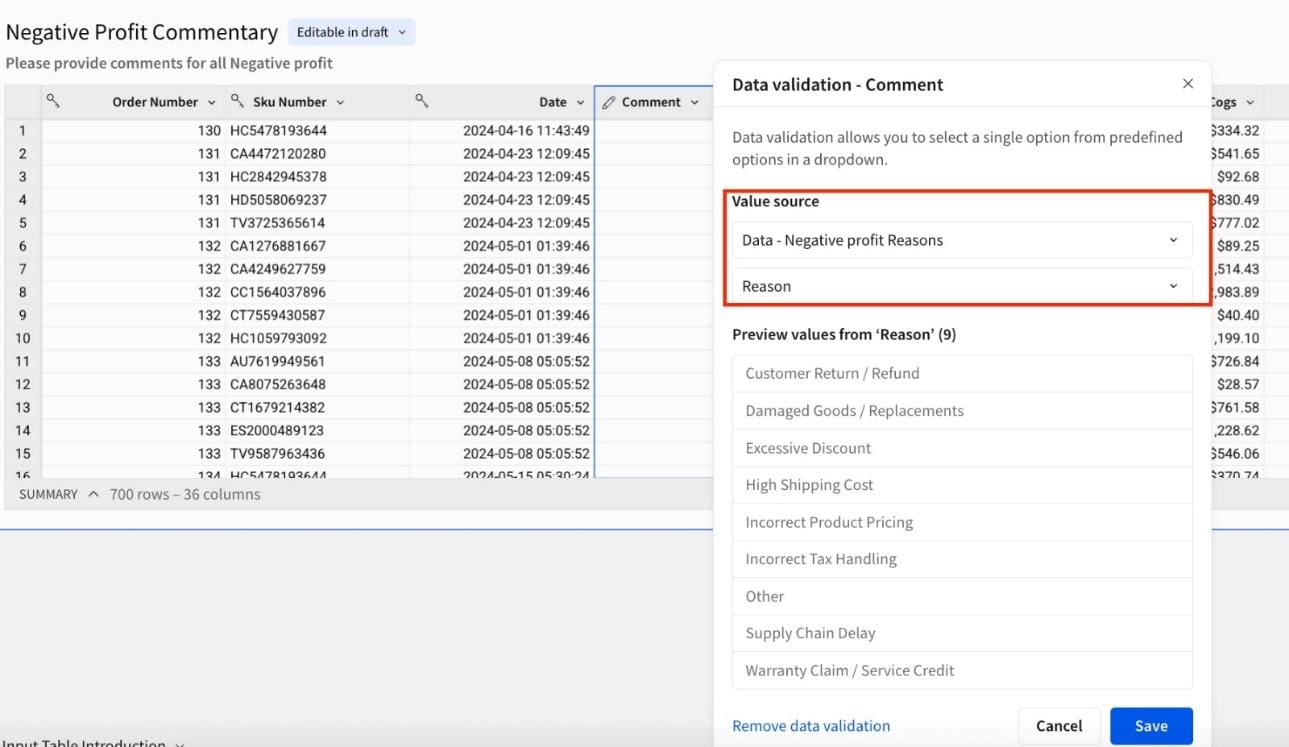
Add a drop-down to the comment column so that users can select from that list only.
Right click on the new comment columns, then Data Validation > Value Source and select Negative Profit Reasons input table values, then click on Save.
Now, try to input values in the Comment column for some rows as below.
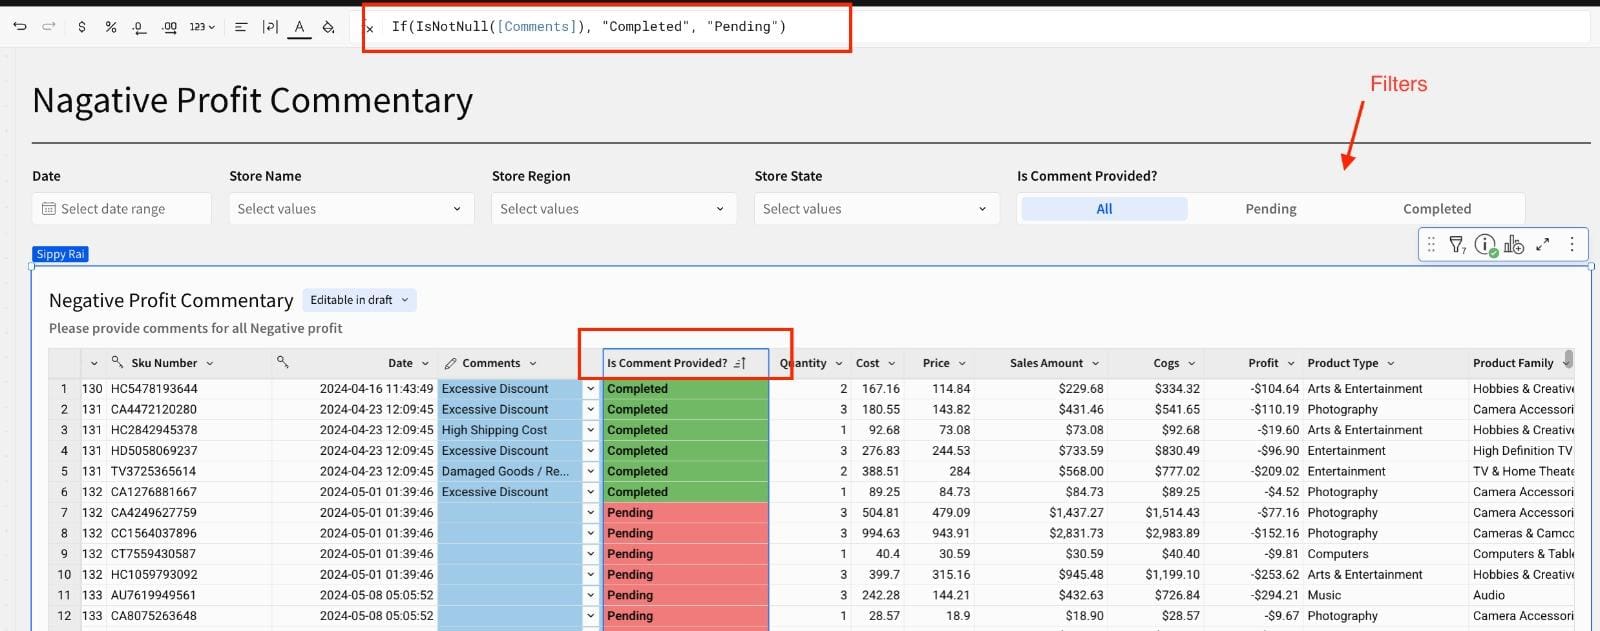
Next, add a new column named ”Is Comment Provided?” to track the status of each entry. Use a formula to check if the comment is filled or pending. Apply conditional formatting to differentiate between completed and pending comments.
Finally, add filters for date, store name, region, state, and comment status to make the table more user-friendly.
Step 3: Visualizing Commentary Status and Trends
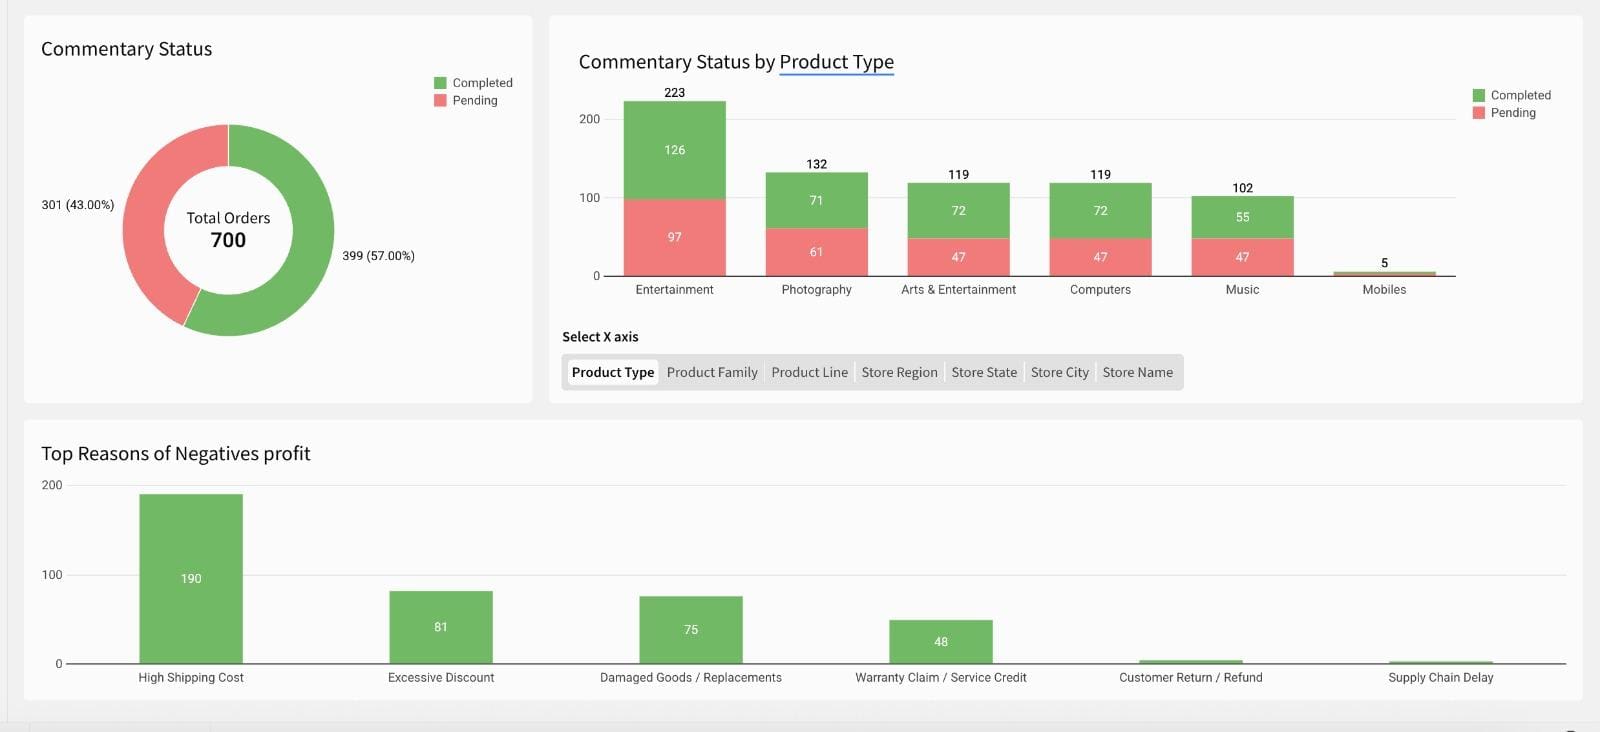
Once input was enabled, we built a dashboard to visualize commentary and highlight insights. Key components included:
Commentary Status coverage: % of negative-profit orders with reasons entered
Breakdowns by dimension: Product Type, Product Family, store name, region, city, etc.
Recurring issues: Top reasons driving negative margins
Order-level drilldowns for detailed investigation
This dashboard gave teams a high-level overview and the ability to dive into specific cases.
Step 4: Automating Email Alerts for Missing Inputs
To ensure timely input and accountability, we implemented automated email alerts. Using scheduled logic, we identified orders with missing commentary and triggered daily alerts to the responsible users.
These alerts can include:
A link to the workbook for action
Attachments with relevant data in formats like Excel, PDF, PNG, or CSV
Besides email, alerts can also be sent via Slack, Google Sheets, Google Drive, etc.
Note: The Export as Email Burst option can be used to send alerts to dynamic recipients, i.e. each user receives only their relevant records. Due to the blog’s length, this part is not covered here.
How to Schedule an Alert?
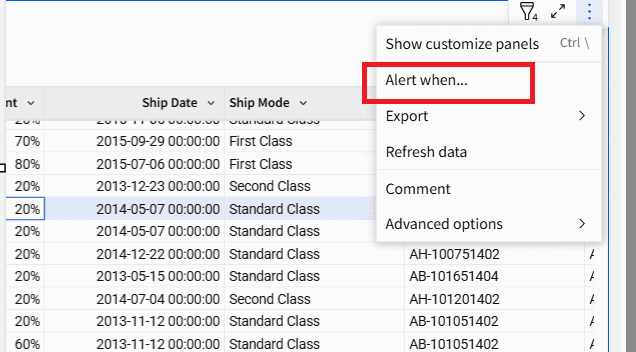
From the top right corner of Negative Profit Commentary input table, click on the 3 dots menu > Alert when. This will open the Schedule exports window as shown below.
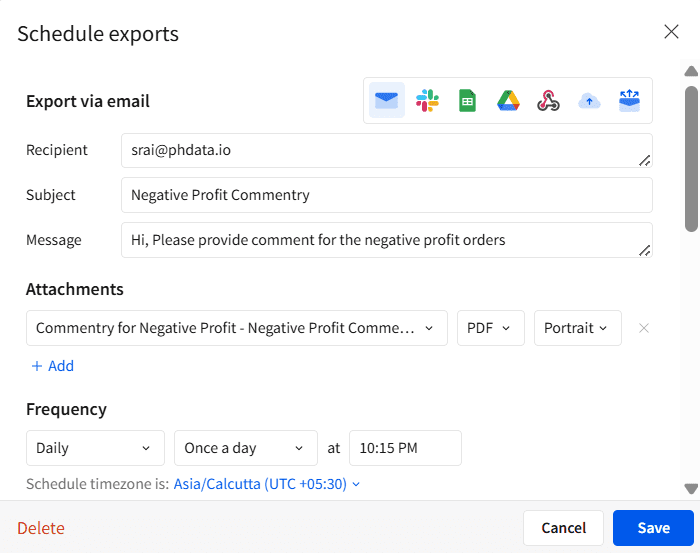
Here, we can configure the Recipient, Subject, Message, and Schedule frequency. Also, attachments can be added to an alert with formats like PDF, Excel, CSV, etc. This will help users to have data available in their inbox itself.
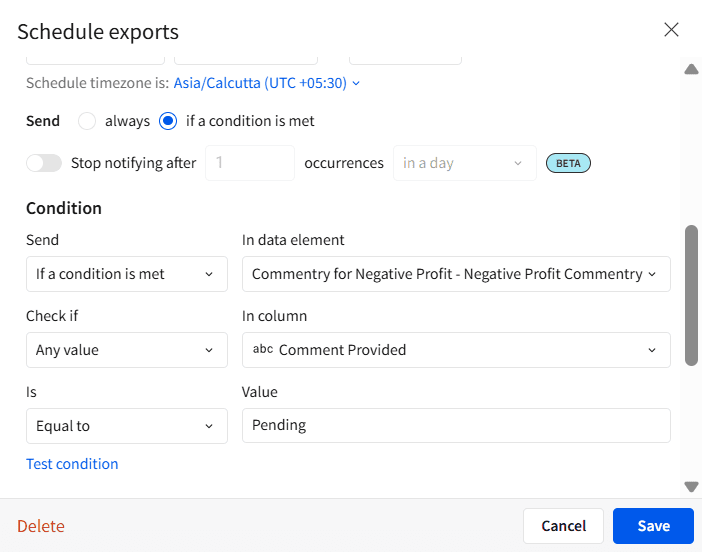
In the Condition section, we need to add a data condition based on which this alert will trigger. In this case, we want to send an alert only when the Comment Provided column value is Pending.
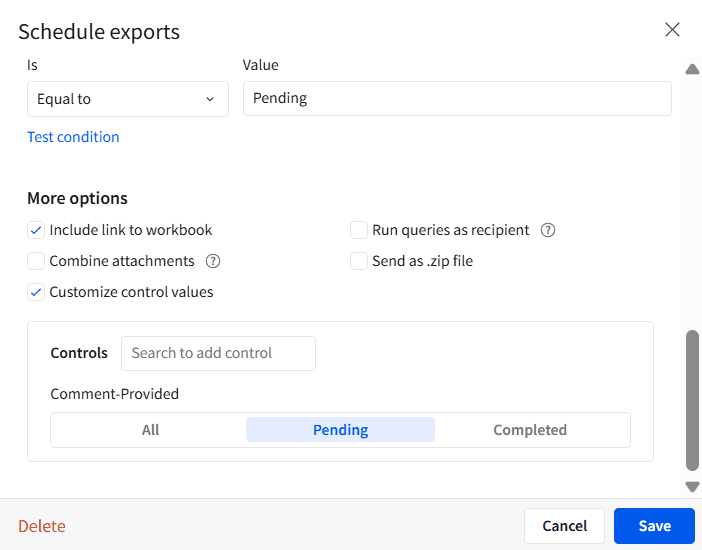
Finally, we need to add control filters that will share only relevant data with users. In this case, we have set
Control Comment-Provided = Pending. Click on the Save button to complete the configuration. You can manually run the schedule from the Schedule exports menu.
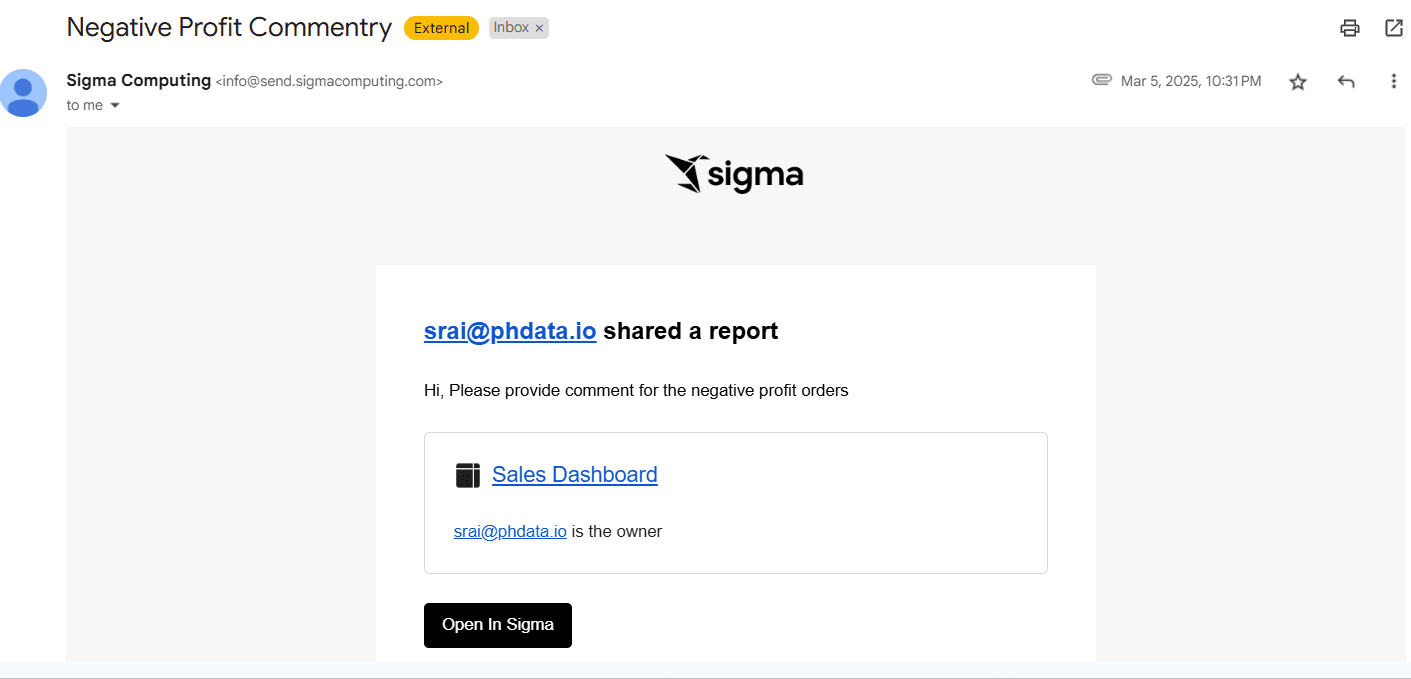
Below is a sample of an email received with a workbook link
Best Practices and Lessons Learned
To make this process efficient and sustainable, we followed a few best practices:
Ensure clean and accurate data: Margin calculations rely on correct cost and price inputs
Limit input complexity: Use drop-downs and predefined fields where possible to simplify input
Encourage cross-functional adoption: Involve sales, operations, and finance teams early
Schedule regular data refreshes to keep both input and visualization data up to date
Monitor input trends to identify recurring problem areas and inform broader process improvements
Conclusion
Negative margin analysis shouldn’t stop at detection, and it should lead to action. By enabling real-time, sales order-level commentary directly within Sigma dashboards, our solution closes the loop between data and decision-making.
With Sigma’s Input Tables, we’ve built a lightweight yet powerful tool that empowers teams to explain, track, and resolve margin issues faster. The result? Better transparency, quicker root-cause analysis, and improved profitability.
Want to learn more?
If you’re interested in building something similar or want to learn more about how interactive BI can support your business challenges, our team at phData is here to help.