Focus on Your Data in Tableau with Zoom To Feature
By Shaun Davis
While reviewing the dashboard I created for my previous post on proximity analysis in Tableau, Steve Fenn made the comment that it would be great if the map would zoom to just show the selected item and those within the radius. This seemed like a great opportunity to implement Set Actions. I’ve been working to implement sets more in the work I do after Filippos Lymperopoulos’ great talk on Sets Appeal (check it out!) at the 2018 Tableau Conference. Set Actions are definitely the new kid on the Tableau block and it’s warranted.
Several folks in the community have attempted to enable this functionality before Set Actions were released. This post by Klaus Schulte at VizJockey is great, but requires the use of another set of data which has the pre-existing maximum extents of the data of interest. Rody Zakovich was also on the same path when shared this tweet which showed a way to update a tooltip based on the points within a set radius of the mouse’s location on the map. This Knowledge Base article shows how to implement zoom to with a filter action, but what if you want to see more than one item or keep other data in context?
What if you could get Tableau to only show those points which are within a radius of a selected point and zoom to it automatically? What if you could select a point on a scatter plot and refine it to those within 1%, 5% or 10% of the selected item? This method enables all of those possibilities and more!
Step 1: Zoom to the Calculated Fields
I’m using data on Florida school locations , but this works with any set of spatial data. This method uses two sets, one with the selected point and one with the data within a set radius of the selected point. Using the data in these sets, we will create a filter which determines if there are any items in the sets and then only shows those items which are contained in either set. Let’s get started!
Create a set named Selected from the ObjectID field. Use the Select from List option and choose None to start with an empty set.
Create a calculated field named Selected X which uses the FIXED Level of Detail Calculation and gets the average of X if it’s in the Selected set.
Repeat the same step for the Y field.
Create a calculated field named Distance which uses the following formula.
Create an Integer parameter named Radius and use the Range option. Set the minimum as 1 and the maximum as 5 with a step size of 1.
Create a calculated field named “Within Radius?” which returns True when the Distance from the point in the selected set is less than or equal to the Radius parameter.
Create a set from the “Within Radius?” field which sets the membership of the set to In when “Within Radius?” is True. This can also be done with a formula on the condition tab.
Create a calculated field named Total = Out of Both Sets, which determines if the total count of records outside of both sets is equal to the total number of records in the dataset or context.
Create a calculated field which determines if either the Selected or Within Radius field is True. This will return True when either of the sets has one or more records in the set.
Create a calculated field which returns True when “Total = Out of Both Sets” is True. If this is False then it evaluates whether “Either Set is True”, or whether the Selected or Within Radius sets, returns True.
Step 2: Build the Map
Create a calculated field named Distance Groups testing for membership in the Selected and Within Radius sets.
if [Selected] then 'Selected'
ELSEIF [Within Radius] then 'Within Radius'
else 'Outside Radius'
end
Place X on Columns, Y on Rows and ObjectID to detail. Add Distance Groups to color.
Filter County to Palm Beach. Filter Type to Elementary, Middle/Jr. High and Senior High.
Filter Op Class to Public
Add all three filters to Context. This will enable the LOD calculations to work properly.
Filter Zoom To to keep True.
Create a dashboard and add the map to it. Create a Set Action which adds items to the Selected set when a user clicks on the item. Choose to keep items in the set when the selection is cleared.
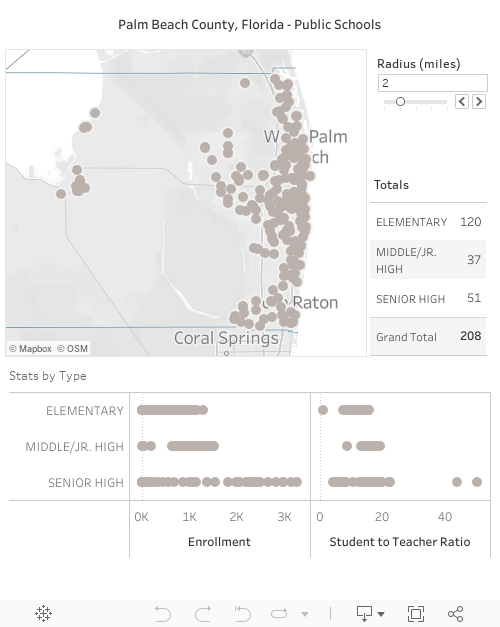
Now users can click on an item and see just those that meet the criteria that they specify. While this example uses a click action on a map and a radius + distance calculation, there is a whole world of possibilities. This method could be applied to scatter plots, used in Tooltips and a whole host of other possibilities.
The dashboard below allows users to select a school from either the map or the chart below it and see which schools are within the specified radius.
More to explore
AI & ML
Why Traditional ERP Systems Fail to Track the Patient Journey in Life Sciences