This blog series, Power BI Basics, is for those new to Power BI, who have a lot to learn, and a lot to digest. I hope that this blog post provides new users with an extra tool in their pocket that they can utilize in their learning journey. Today, that tool is the toggle switch. Toggle switches are a feature that, when used properly, can be an impressive addition to a report or dashboard.
In this blog we will:
- Debunk some misconceptions involving how toggle switches are meant to be used
- Go over step by step how to create toggle switches in Power BI
What are Toggle Switches?
Why are Toggle Switches Important in Power BI?
When to Use Toggle Switches in Power BI
Binary Choice Toggle Switch
Think of the light control switches you use daily, one side turns the lights on and the other side turns them off. All toggle switches should follow this dynamic of shifting between two binary on/off options. There should be a clear default value or setting, and the options should always be mutually exclusive. In the case of the light switch, the feature in question is the light and the default is no lights.
One common misuse of the toggle switch is applying them between options that cannot be viewed in binary terms. In this scenario, the toggle is used not to switch a feature on or off as intended, but to switch between features entirely.
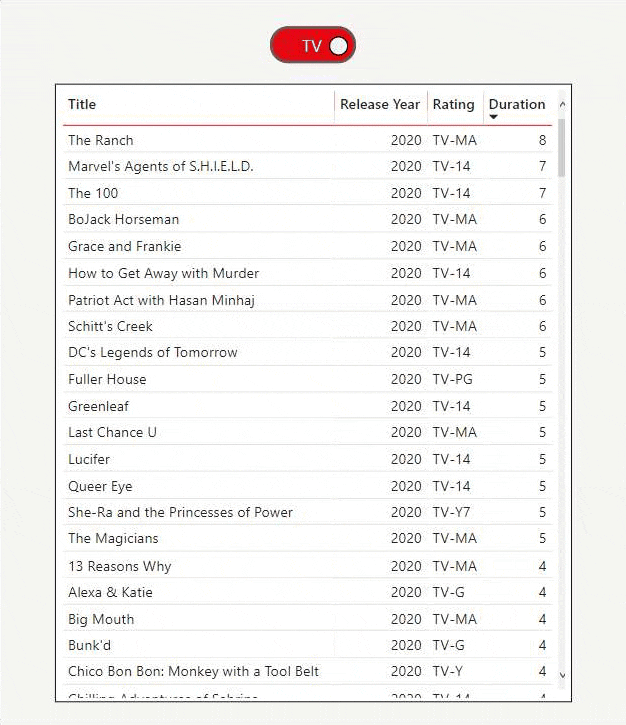
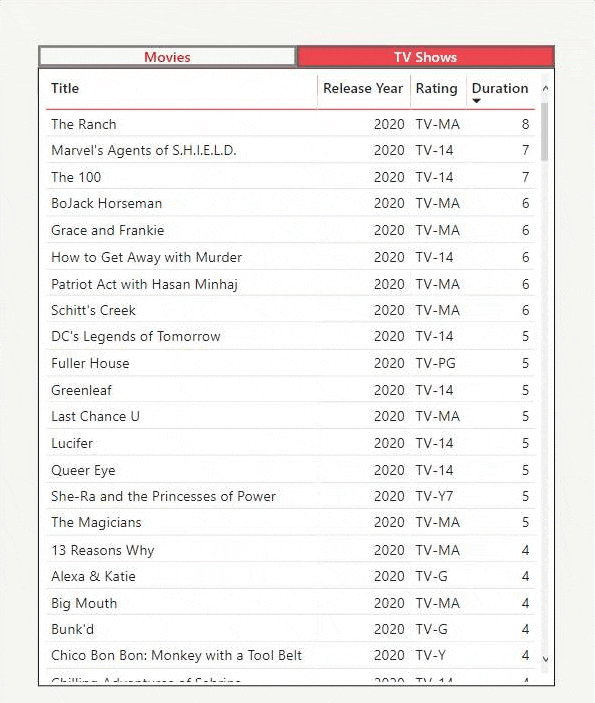
In the example below, there is no obvious default and there is no feature switching between on and off. The ability to look at the list of movies and the ability to look at the list of TV shows are two separate features.
A better way to switch between non-binary states, in this case, is to use a toggle button, which is similar to the toggle switch but excludes the switch movement. The toggle button allows for immediate results without requiring the binary dynamic the toggle switch is known for.

Immediate Effect Toggle Switch
Another distinctive characteristic of the toggle switch is its immediate effect. When using one, the effect of the switch should be implemented immediately after toggling. A “SUBMIT”, “APPLY”, or “SAVE” button should not be necessary. Just imagine having to save your settings every time you go into or out of airplane mode on a phone, what a hassle that would be!
This characteristic of the toggle switch is a clear differentiator between it and other frequently used UI elements such as checkboxes and radio buttons. The automatic nature of the toggle switch is what lends it its usefulness in systemic changes.
When to Use
- When the options are mutually exclusive
- When users must decide between turning a feature on and off
- When there is a default state or functionality
- When the change or effect should be made immediately
When Not to Use
- When the options are independent of one another
- When there are multiple options available
- When the user must validate the changes with another button
How to Create Toggle Switches in Power BI
Now that you have an idea of when to include a toggle switch, we’ll move onto how to make them. There are two different ways to create them in Power BI, depending on your situation.
- Create a toggle switch with the Power BI blank button
- Create a toggle switch with downloaded toggle images
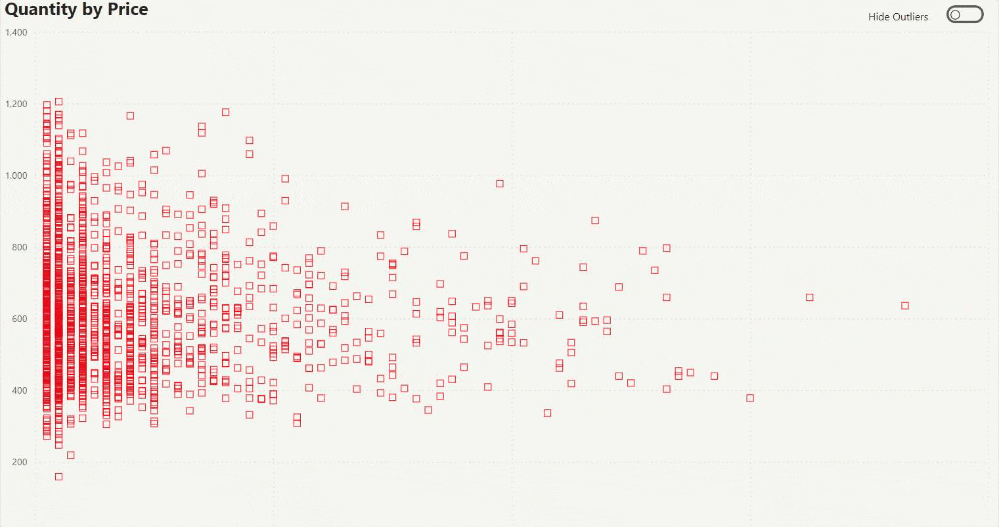
I will show you step by step how to make a toggle switch using a Power BI blank button that shows or hides outliers in a graph as illustrated below.
1. Set up the Dashboard
Create the same graph with and without the outliers and lay them on top of one another, making sure to appropriately name each in the Selection field, which can be accessed in the View tab.
2. Create the “Off” Toggle
Add a blank button from the Insert tab and name it in the Selection field. Now that you have a blank button, you will format it to look like a toggle switch in the off position. Turn the Button Text on, and in the button text panel, click the Windows button and the semicolon to pull up the Windows emojis. Type in ‘circle’ to find the white circle emoji, and add it to the text panel. *You could also look up “white circle emoji” online and copy and paste it into the text panel* Center the text to the left so that the switch looks like it is in the off position and utilize the padding parameter to center the circle within the button if necessary. In Outline, change the Round Edges to 20px to make the button rounded. Remove the background and adjust the size of the button.
3. Create the “On” Toggle
Now to make the toggle in the on position, copy and paste the toggle that was just created. Again, name this toggle switch in the Selection field. Center the text to the right so that the switch looks like it is in the on position. Change the fill color to suit your dashboard theme. Now that you have the two toggle switch positions, place the buttons on top of one another.
4. Label Toggles
For clarity, create two text fields to describe the toggle options and name them in the Selection field, putting both in the same location next to the toggle switches. *Short, concise labels are essential here*
5. Utilize Selection Views and Bookmarks
In the Selection field, hide the graph with the outliers, the toggle switch that is positioned on, and the text you would like to show when the toggle is on. In the View tab, open the Bookmarks field. Add a bookmark for this view, naming it appropriately. Now hide all the previously viewed items and “un-hide” the previously hidden items. Add a bookmark for this view, naming it appropriately. For each button, add a bookmark action to the appropriate bookmark.
6. Voila! You have Yourself a Working Toggle Switch!
Phew, that was a lot of instructions. You can follow along with the steps in this video to watch me go through the process.
Outside of building the toggle switch from scratch in Power BI, in the other option I mentioned previously you could download images of a toggle switch in the on and off position online, add the images to the dashboard, and turn them into buttons that switch between bookmarks as I’ve described above. This would be a good option if customizing the toggle switch is not necessary.

Now that you know when to use them and how to create them, go ahead and add a toggle switch to your next Power BI dashboard!
Extra special thanks to Jacob Kahn for inspiring this post.


