Parameters allow users to interact with the back-end logic in a dashboard. I’m grateful any time a data visualization tool has some kind of parameter functionality, as many currently lack it. For example, while trying out different tools and researching for this blog post I discovered that Domo does not have this functionality. However, Tableau and Looker are both capable of creating parameters. Let’s compare the two and their parameter capabilities.
To compare the two, I’m going to look at 3 different aspects of parameters:
- How to create the parameter
- How to make the parameter functional
- How users interact with the parameter
I’m going to use the same simple use case in both Tableau and Looker: a dynamic KPI. In this case, the parameter will determine which items we will do a count distinct on.
Note: In case you’re not familiar with Looker, I’ve already done an overview of the product that might provide some helpful context. The rest of this post will assume some knowledge of Looker, so I’d recommend taking a peek at what I thought about the platform in my Look at Looker post.
Creating Parameters
Let’s start by creating the parameter that user will interface with. We want a string parameter that will list a number of dimensions to do a Count Distinct on. I’ll keep it simple and do orders, customers, and products.
How to Create a Parameter in Tableau
Tableau has a very simple user interface for creating a parameter. Click the caret on your data pane and navigate to “Create Parameter”.

I can easily name the parameter, turn it into a String, and create my list of allowable values.

How to Create a Parameter in Looker
Creating a parameter in Looker will have a lot of the same steps as in Tableau, but instead of an interface, we will build it ourselves in LookML. This will require development privileges on the platform, so let’s enable development mode and get started.

I’ve opened the LookML for a sample view, Order Items. In here, I will add the keyword parameter: to declare my new parameter. I’m naming it Item to Count, like our parameter in Tableau.

Now on to creating our list of allowable values using the allowed_value keyword. Allowable values have two parts: value and label. In this case, value and label will be the same thing but I will show the format below for demonstration purposes.

Our parameter with all allowed values looks like this in LookML:

Making Parameters Functional
Both programs require linking the parameter to some sort of calculation or field. Let’s walk through both of these processes.
Setting up Functionality in Tableau
For Tableau, we’ll link a field to the parameter with a Calculated Field. I’m going to create a field with a simple CASE statement, that determines which field will be used based on the parameter’s value. The end calculated field looks like this:

Setting up Functionality in Looker
To link the LookML parameter to a meaningful behavior, we’ll also need to create an additional field in the form of a measure.
We’ll start with our keyword measure and, because we want this to always do a count distinct, we’ll make the type count_distinct. Now comes the SQL statment.
Using a CASE statement, we will cover all of the possible values of our item_to_count parameter. To refer to the parameter in the WHEN clause, we’ll use the liquid variable {% parameter item_to_count % }. Depending on the value we use, our THEN will give us another LookML dimension to do a count distinct on. We’ll refer to the LookML field with ${field_name}. A full when statement will look like below:
WHEN {% parameter item_to_count % } = 'Orders' THEN ${order_id}
This is the final measure in LookML:

Now we’ve got the fields, and after some testing in my development branch in dev mode, I can see that they work like a charm. I can continue working with this in my development branch, but any dashboards utilizing these fields will show up blank or errored outside of my branch. This is because they haven’t been pushed to production.
Once I’m happy with how these will work, I can commit the changes and push to production for use in dashboards outside of my dev zone.
Interacting with Parameters
Now let’s set up the visualization so the end-user can use it.
Parameter Interfaces in Tableau
To start using this parameter in Tableau, right click it and select “Show Parameter Control”.

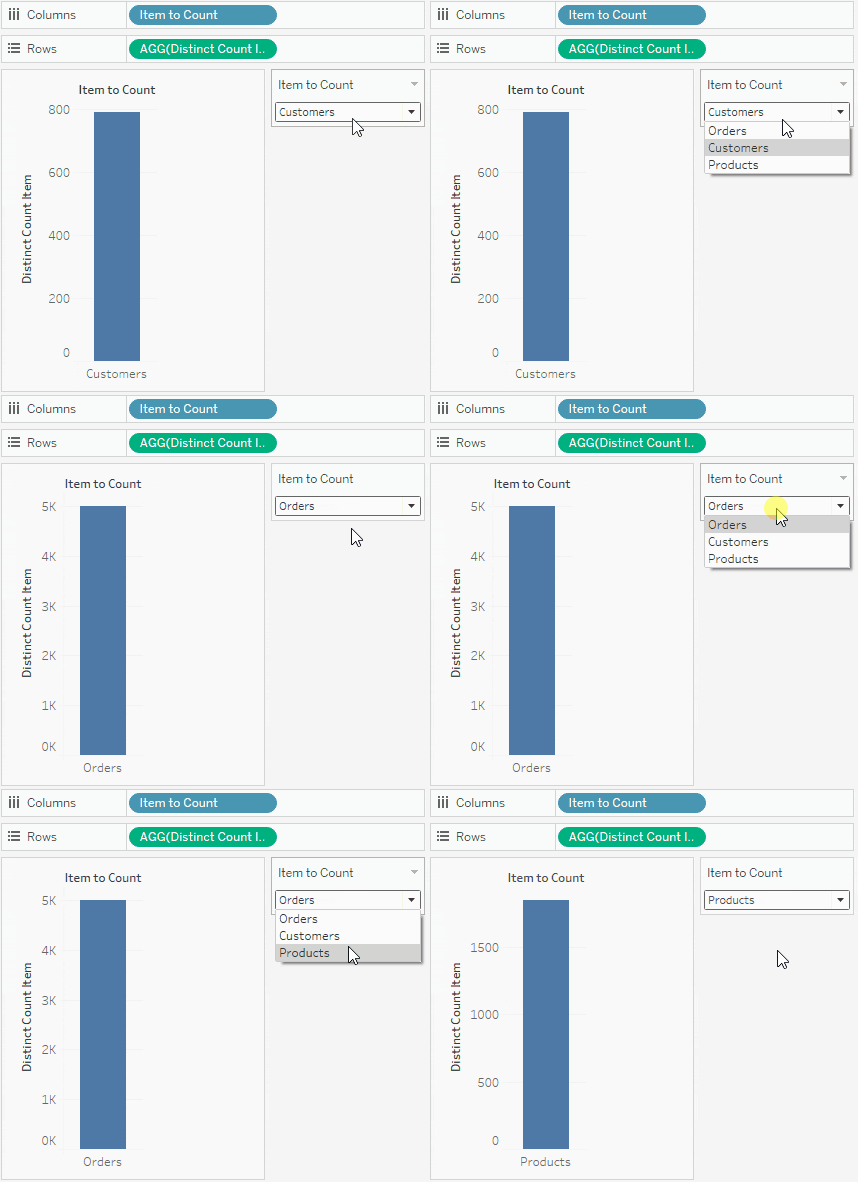
Next, we’ll set up the visualization. Drag the [Item to Count] parameter on columns and [Distinct Count Item] on rows.

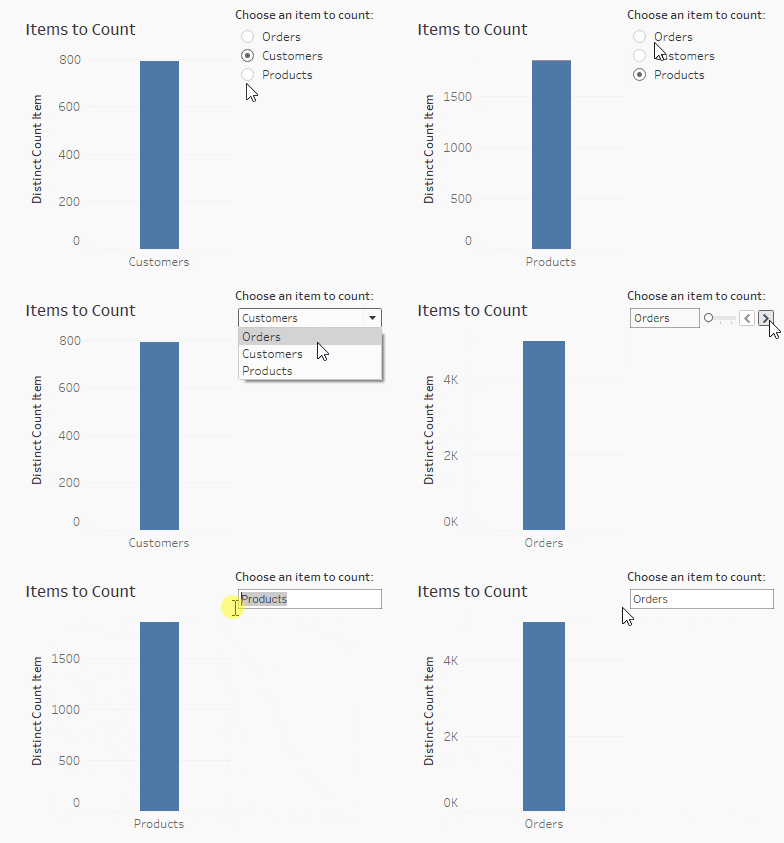
When I put this on a dashboard, I have a variety of options to customize the user experience, including the title prompting the user to interact with the parameter, and the actual interface of the parameter. In the below gif, I am demonstrating some of those options.

With the release of Parameter Actions, we also see additional possibilities to make parameters more interactive.
Parameter Interfaces in Looker
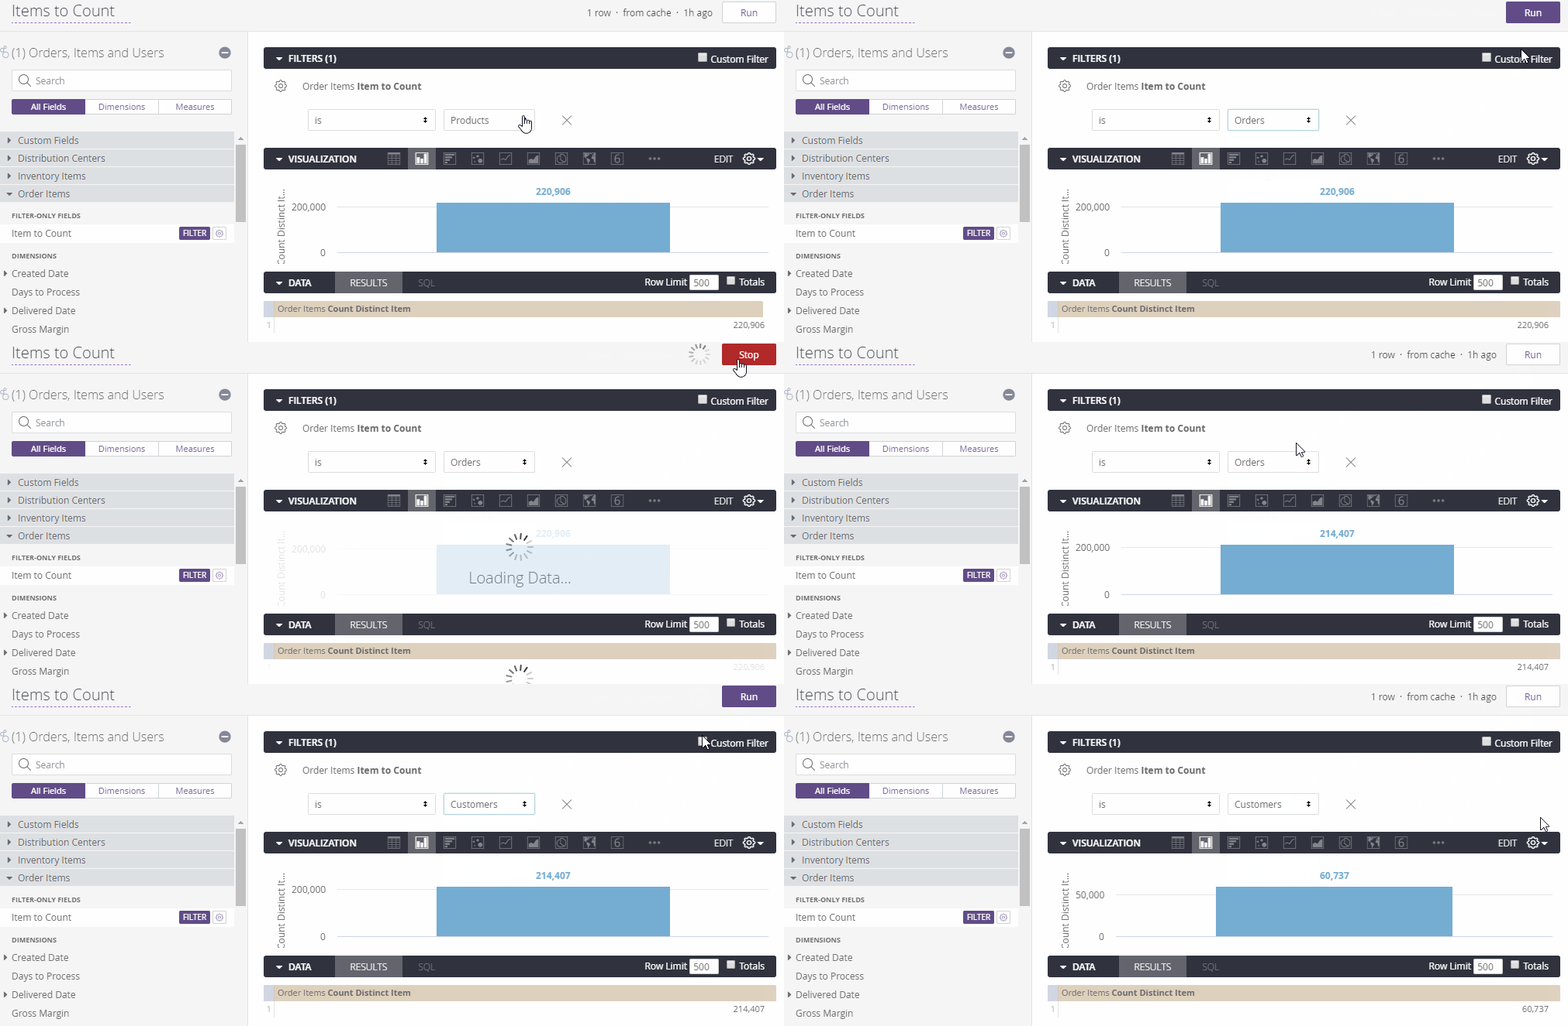
To build the viz in Looker, select your Count Distinct Item field and use the Filter-Only value (our parameter) Item to Count to control the value.

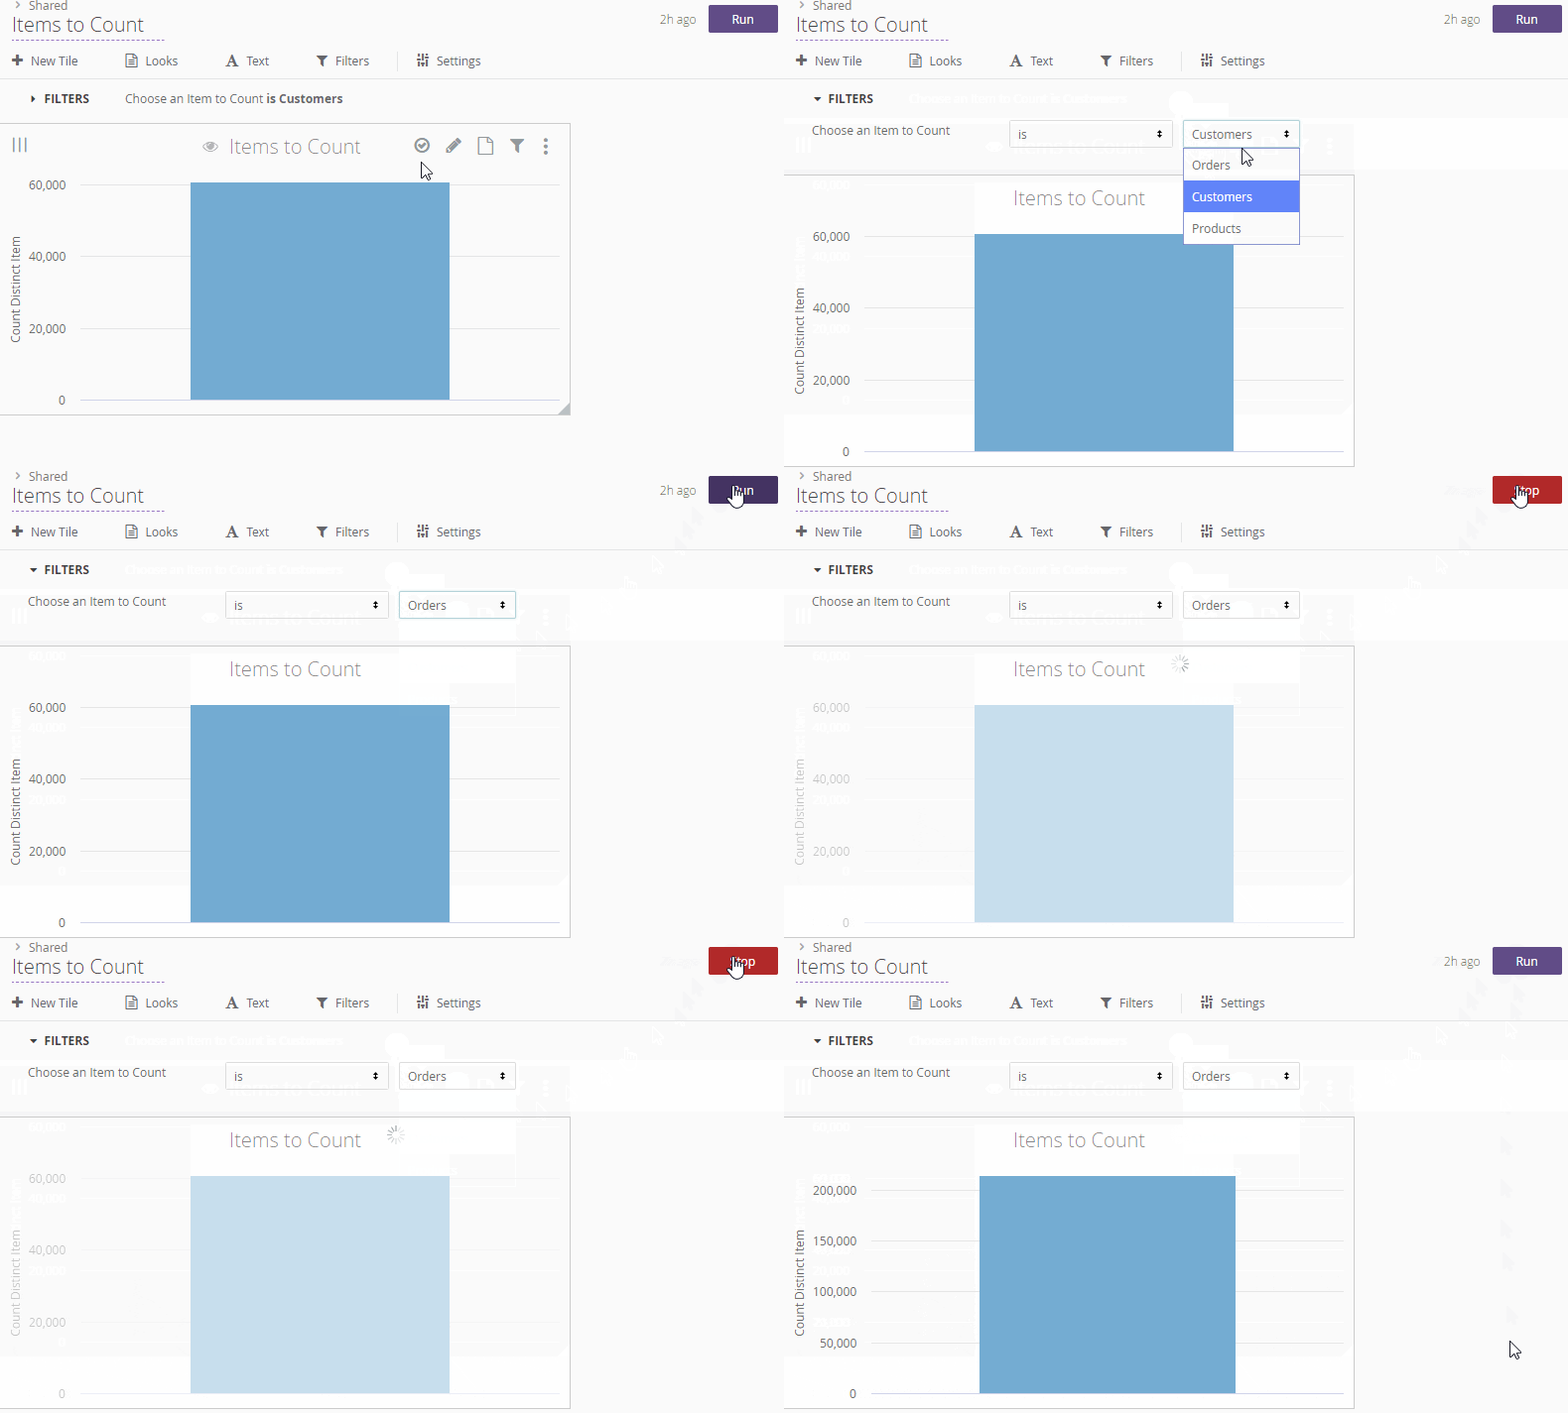
When we add this to a dashboard, you can remove this filter from the viz because we will add it at the Dashboard level for the users to interact with. To do this on the Dashboard, click “Filter”. In configuration, select the value you want to use as the filter and which tiles it should update, then click “Save.” I can also change the text that prompts the user to interact with the filter. This will result in the below dashboard.

Unlike in Tableau, we need to manually run the dashboard again before the viz updates. This is the extent of our options for updating the parameter.
Thoughts and Conclusions
The steps to create a parameter are very similar between Looker and Tableau. Where they differ is the experience and the end-user experience.
Pros for Tableau Parameters
- Simple interface for creating parameters
- Wide variety of options for interacting with parameters
- For string parameters, ability to bulk insert allowable values from fields
- Can be used cross-data source
Cons for Tableau Parameters
- Requires some knowledge of Tableau calculations
- Cannot format individual parameters controls; all are formatted at once
Pros for Looker Parameters
- Easy to build visualizations off of existing parameter
- Very simple to build for LookML/SQL-users
- Easy to test in your own development environment
Cons for Looker Parameters
- Less user-friendly interface due to manual coding
- Cannot be used cross-explore
- Elevated developer privileges required to create a parameter
- Little room for customizing parameter UX
- You may have noticed there was no label on the Looker bar graph indicating what has been counted. Because parameters are Filter-Only values, it would take another string dimension field to get that.
- Requires some knowledge of LookML and SQL
Tableau’s interface and flexibility becomes the key differentiation here. Because of this, I think Tableau is a clear winner.
Do you have more questions about Tableau? Talk to our expert consultants today and have all your questions answered!


