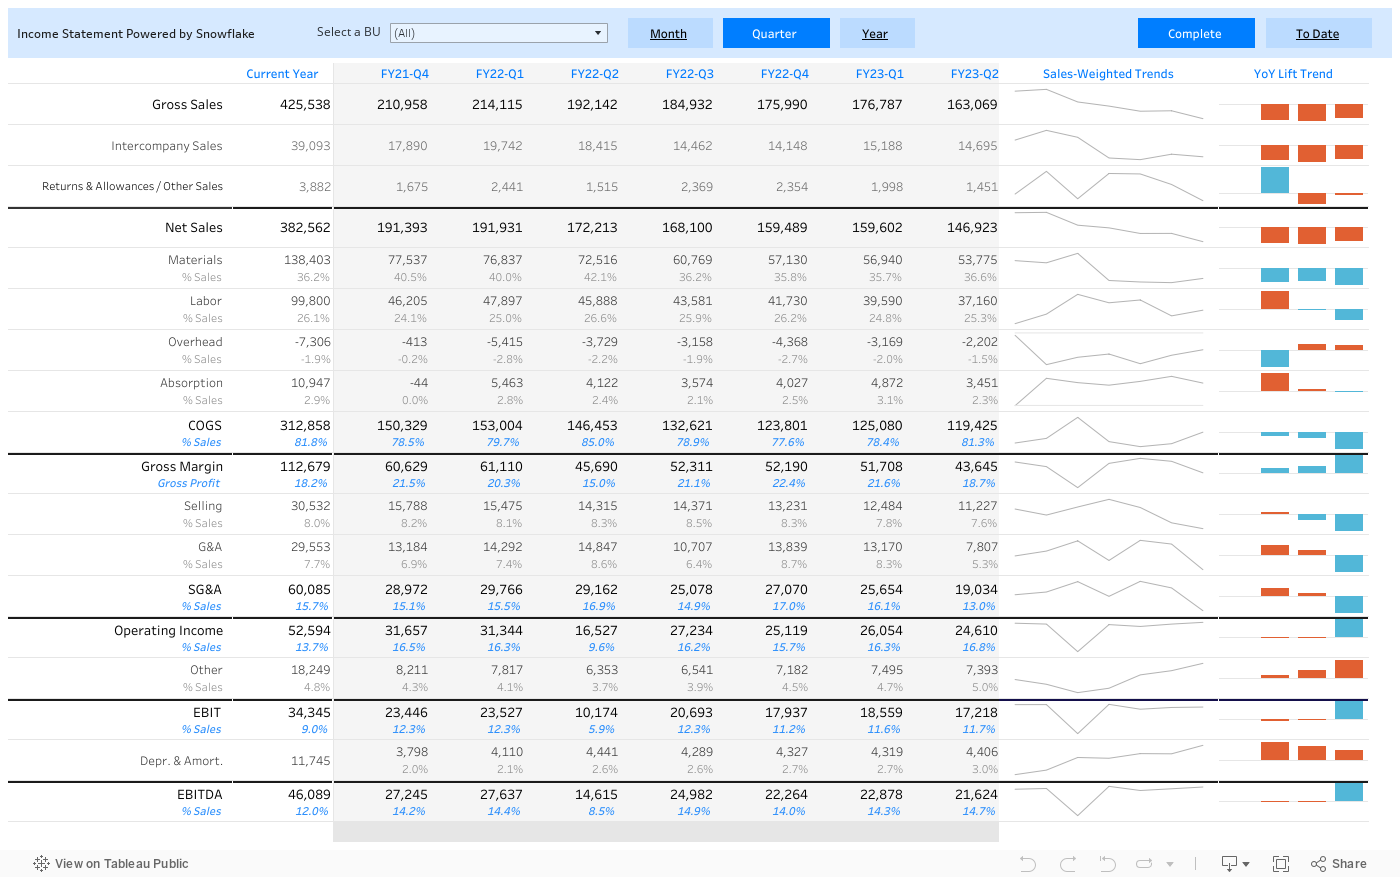
A dynamic income statement dashboard built in Tableau is an invaluable tool for any company. It allows businesses to quickly and easily track their financial performance over time and gain insight into their financial stability.
This Tableau dashboard can be used to analyze trends in income and expenses, assess the profitability of various business segments, and identify areas of potential cost savings.
Tableau’s powerful visual analytics capabilities make it easy to quickly spot patterns and gain insights that would otherwise be difficult to come by. This dynamic income statement dashboard is the perfect way to keep your business running smoothly and maintain financial stability.
About the Data
This dashboard is built on example data provided by the Snowflake Data Cloud and an ERP. This could be SAP, Oracle, or Netsuite. For smaller enterprises or even small companies, this can be accomplished with QuickBooks.
With this dynamic income statement dashboard, users can quickly and accurately gauge the financial performance of the company. The data is automatically updated with the latest sales and expense information, allowing users to stay up-to-date on the financial health of the company.
This dashboard is a valuable asset for any business, as it helps to ensure that the company is making the right financial decisions.
Who is This Dashboard For?
A dynamic income statement dashboard built in Tableau is typically used by business owners, financial analysts, and other executive stakeholders who need to gain insight into the financial performance of a business.
They are required for every company.
What You Can Accomplish With Dashboard
With this dashboard, these users could gain insights into the business’s profitability, identify financial trends over time, and analyze what factors are driving revenue and expenses.
For example, a business owner could use the dashboard to compare year-over-year sales performance, analyze the profitability of different product lines, and identify cost savings opportunities.
A financial analyst could use the dashboard to identify changes in the company’s financial performance over time, analyze the impact of new investments, and evaluate financing options.
Finally, a stakeholder could use the dashboard to explore the company’s cash flow, assess the impact of strategic initiatives, and monitor financial performance against goals.
In Summary
A dynamic income statement dashboard built in Tableau is far superior to traditional pdf reports from Quickbooks, as it provides more comprehensive insights into the business’s financial performance.
Tableau dashboards are interactive and customizable, allowing users to quickly drill down into different areas of the income statement, such as revenue, expenses, and profits, to gain a deeper understanding of the business.
Furthermore, Tableau dashboards can display data over time, enabling users to monitor trends and make faster, more informed decisions.
Finally, Tableau dashboards are highly scalable, allowing users to quickly adjust the view of the dashboard to suit their needs.
If you have any questions, need help, or are interested in having a team of Tableau experts design dashboards for you, feel free to reach out!