How to Use Multiple Collapsible Containers in Tableau
By Luke Stanke
Tableau 2021.2 presented a new feature that allowed for collapsible containers on dashboards. This tutorial shows you how to use multiple collapsible containers on a dashboard.
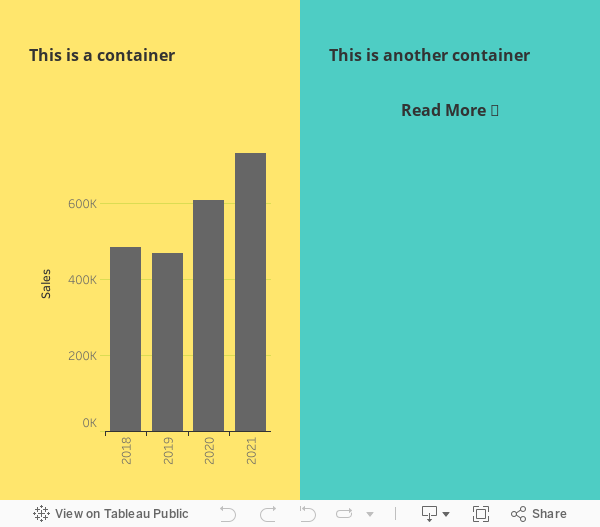
For background, you will be embedding multiple containers in another container. The result will be similar to the visualization below:
Step 1: Create a new dashboard. For this example we’ll set the width to 1000px and the height to 800px.
Step 2: Add a floating horizontal container. Set the x to 0 and the y to 0. Set the height to 800px (the total height of the dashboard). Set the width to 6000px or a width that will extend well past the viewable window of Tableau Server.
Step 3: Add a Blank object. Place the blank container inside the horizontal container. This will help later with the sizing of our objects.
Step 4: Add a vertical container. Place the vertical container inside the horizontal container to the LEFT of the blank object. Set the width to 500px.
This will be “Slide #1”. Add any worksheets in this container.
Step 5: Add another vertical container. Place the vertical container inside the horizontal container to the RIGHT of the first vertical container but to the LEFT of the blank object. Set the width to 500px.
This will be “Slide #2”. Add any worksheets or text to this container.
Step 6: Add a Show/Hide Button for the first vertical container. Select the vertical container and from the dropdown check “Add Show/Hide Button”.
Take the new button and place it inside the right vertical container and format the button. I’ll format the button using text to say “Read More” or “Go Back”. I’ll also remove the button-like look.
After you finish formatting, size the button.
Step 7: Test the button. Hide the container to make sure it works. You should return just the right-most container at the exact same width.
Step 8: Add more “Slides”. Make sure that “Slide #1” is hidden. Add another vertical container between “Slide #2” and the Blank object. Set the width to 500px and repeat Steps 5-7. Repeat until you have the desired number of “Slides”.
Step 9: Show all containers. While you must develop in the visible region of a dashboard, the visualization will eventually extend past that region (thats why you made such a wide container to start). When you are finished show all containers then publish.