

You can build all the beautiful charts in the world but sometimes it’s something as simple as a table that’s going to fit the client’s needs. However, if you’re dealing with a lot of data, this can be overwhelming with what feels like endless scrolling. That’s where pagination comes in. There are a lot of ways to do this. In fact, here’s a method by Luke Stanke also on our blog. But I wanted to show you how I do it and some of the things I consider when setting it up.
Here’s our pagination recipe:
- 1 Parameter
- 4 Sheets
- 5 Calculations
- 2 Parameter Actions
Create an Integer Parameter
The first sheet will just be the table that you would like to apply this to. For this example, I’ll be using Superstore data and looking at sales by customer. Next, create an integer parameter allowing for all values (it’ll be referred to as ‘Page Number’ in this blog). This is what we’ll use to change the page number the user is on.
Make First Calculation to Filter the Table
Now we’re going to make our first calc. This will be used to filter the table we previously created to a specific number of values corresponding with the page we’re on. Here you’ll have to decide how many rows to display on each page. I’m going to use 20. If you would like to keep this flexible and let the user choose, you can add a second parameter here to allow them to change the number of rows per page.
					INDEX() <= [Page Number] * 20

AND

INDEX() > [Page Number] * 20 - 20
Explanation: The index will return the row number. We only want to display 20 rows per page. This calc looks at the page number and multiplies it by 20 to find the row number of what would be the last row on the page. Subtracting 20 from that value gives us the row number for the first row on the page. This calc returns what’s in between.
Place the calc you just created on the filter shelf of your table and set it to true with the table calc going down the table.
Let’s also create a calc to tell us how many pages there are in total. This will be helpful in several places.
CEILING(COUNTD([Customer Name])/20)
Explanation: The distinct count of customers tells us how many rows there are in the table in total. We’re dividing that by 20 (the number of rows per page) to see how many pages there are for the data. We’re taking the ceiling of that to account for the fact that there will likely be a total number of rows that’s not cleanly divisible. The ceiling is like round if round always went up. For example, if there were 39.45 pages, you’d actually have 40 pages.
Navigating Between the Sheets
Next, we’ll need to create a way to navigate between the sheets. We will do this with two more calcs, two more sheets, and two-parameter actions with one of each being used to go forward and the other backward. Let’s start with forward.
IF [Page Number] < [Total Page Numbers] THEN [Page Number] + 1 ELSE 1 END
Explanation: If we aren’t at the last page, we want to add one to the page parameter to take us to the next page. If we are at the last page, we want to go back to the first page.
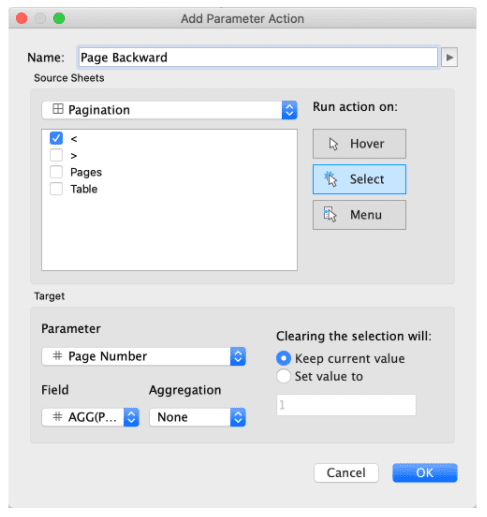
On a new sheet, you’ll take this value and put it on rows as a discrete measure. Choose your desired mark type. I usually use an arrow that’s pointing to the right but a ‘+’ sign or the words ‘next page’ will work as well. Make some slight formatting adjustments by unshowing the header and removing borders. Add this to your dashboard with your table. Go to Dashboard > Actions and create a new parameter action. Select the sheet you just created, choose select in the ‘Run action on’ section, put your ‘Page Number’ parameter as the parameter, the calc from that sheet as the field, the aggregation as ‘None’, and keep the current value when clearing the selection. You’ll now find that pressing the mark on this sheet moves the pages forward.
Now to go the other way. It’s very similar.
IF [Page Number] > 1 THEN [Page Number] - 1 ELSE [Total Page Numbers] END
Explanation: If we’re not on the first page then subtract 1 from the page number parameter, otherwise, go to the last page.
Setting up this sheet is the same as the previous method. Though for the mark type I normally use an arrow pointing to the left (‘-’ sign or ‘last page’ will work). Add this sheet to your dashboard and add another dashboard action with the same settings we used before.
Technically we can stop here! You have successfully constricted the number of rows in your table and allowed the user to move forwards and backward through the pages. But there’s a couple of things I like to add.
Adding Total Number of Pages
Your user might not be familiar with the data and therefore might not know just how much of it there is. Let’s tell them. Something I like to add with this method of pagination is another sheet with the total page numbers and the page that they’re on. And this is really simple because it uses things you’ve already seen.
On a new sheet, add the ‘Total Page Numbers’ calc to text along with a calc containing just the ‘Page Number’ parameter (I usually just do an ad hoc calc for this). Edit the text to the following.
Page <Parameters.Page Number> of <AGG(Total Page Numbers)>
Add this sheet to your dashboard between the buttons you created to toggle forward and backward through the table.
Restricting the Buttons
One final touch I usually add is to restrict the buttons and page number to only be visible if there’s more than one page. This step will be dependent on your data and the filters available on the dashboard, but in the scenario that there is only one page, the user wouldn’t need pagination. Use the following calc [set to True] as a filter across the page number and button sheets.
[Total Page Numbers] > 1
In Conclusion
And there you go, this is how I accomplish pagination. But there are many ways to do it and many considerations to make. Be on the lookout for future blogs on extra things you can add to amp up this method even more.
Need more help making your Tableau dashboards a work of art? Our knowledgeable team of Tableau experts is here to help!


