If you work with dates in your data set, then it will be important for you to understand the difference between date parts and date values in Tableau. If you are relatively new to using Tableau, then this post can help clarify those distinctions. And even if you have been using Tableau for some time, you may learn some new tips and tricks in this post.
In this post, we will cover the difference between date parts and date values and help provide some guidance for which option to choose as you are building out your charts in Tableau.
What is the Difference Between Date Parts and Date Values in Tableau?
Just like all other fields in Tableau, date fields can be discrete or continuous. Date parts in Tableau are the discrete version of your date field. Date parts break a date down into individual pieces. Date values in Tableau are the continuous version of your date field. Date values represent the date along a continuous timeline.
A useful way to see and understand the differences between date parts and date values is by building charts and drilling down in those charts.
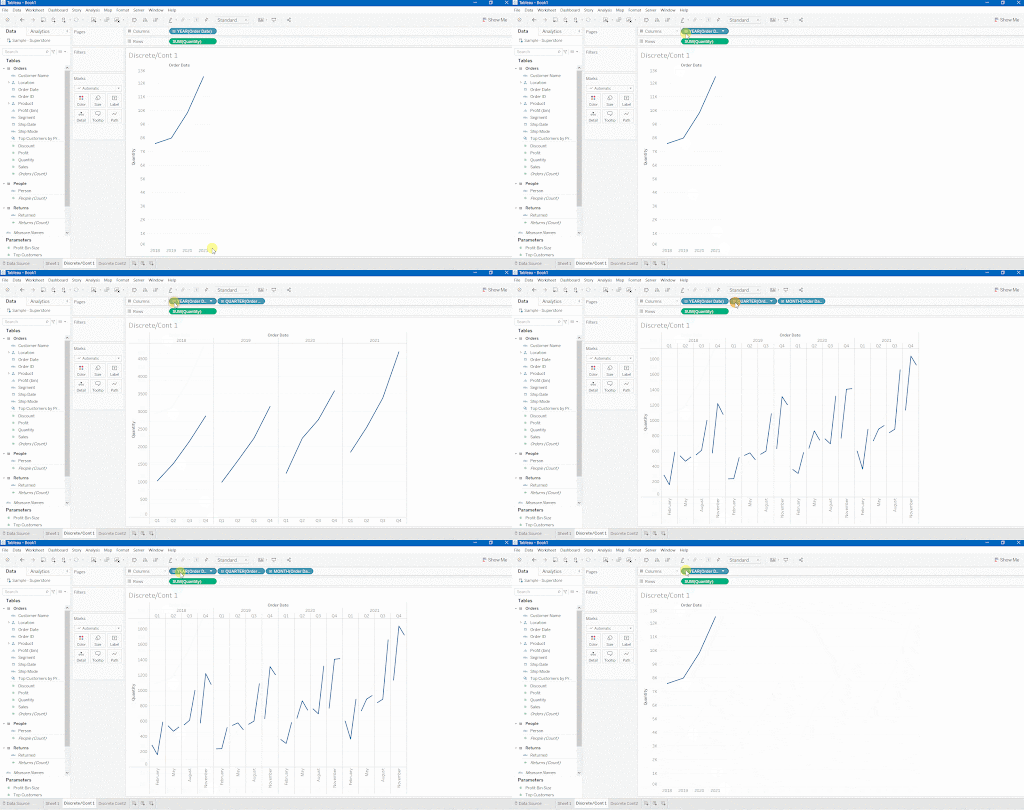
In the first example below, we have a chart that is using the date field as a discrete date, in other words, as a date part. Notice how the date field in this example is blue, which happens when the field is discrete.
As we drill down into the YEAR of Order Date, we see that Tableau is breaking that single line into parts. First, the line is broken into parts for each quarter. Then those lines are broken down further into individual parts for each month. Date parts will have headers for each piece and you may have borders distinguishing between the different pieces (e.g., the different years or the different months in the view).

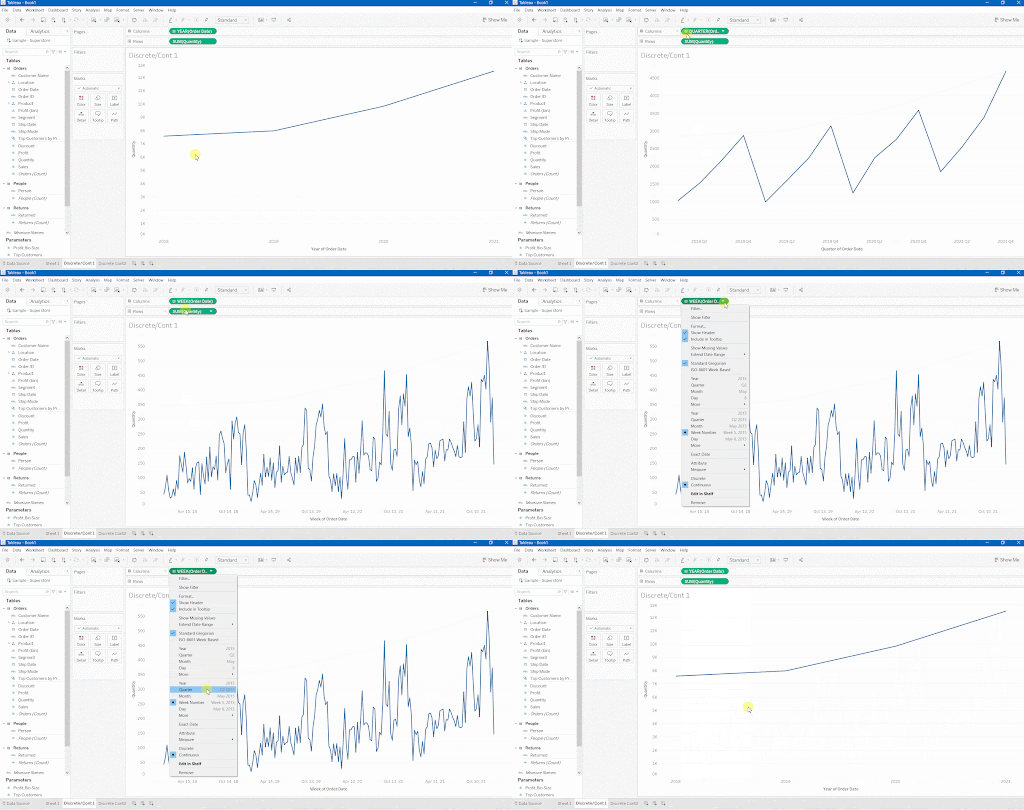
In this next example, we have a chart that is using the date field as a continuous date, in other words, as a date value. Notice now how the date field is green, which happens when the field is continuous.
As we drill down into the YEAR of Order Date in this example, we see that Tableau does not break that single line into parts. Instead, date values represent the data along a continuous timeline, where you can still group as you choose. For example, May 2018 would contain all dates from May 01, 2018 through May 31, 2018. That data point would represent the sum of the data within that grouping.
Unlike the distinct groupings and hierarchies of date parts, date values reveal more detail as you move down into the next level down of the date.

Why is it Important to Understand the Difference Between Date Parts and Date Values?
As you can see, the decision to make your date field discrete (as a date part) or continuous (as a date value) impacts how the data is represented and displayed in the chart. If it is important to represent the information across a continuous timeline, then you should select to display the date data as continuous date values.
On the other hand, if you are most interested in representing the data as different parts, then you should select to display the date field as date parts. For example, you could compare the sales totals of all of the orders submitted on Mondays versus Fridays. This chart would be best represented as a bar chart.

Notice that the date field is a blue (discrete) field representing WEEKDAY date parts.
This option, to select to display the data by weekday, is not one of the defaults that will display when you drill down into a date field. You will need to create a custom date field in order to display the data by weekday. Whenever you create a custom date you will need to select whether that field will be a date part or a date value. Let’s take a look at how to do that.
How to Create a Custom Date Field
Option 1
This first option will enable you to create a custom date field that will be added along with your other fields in the Tables pane. You will be able to continue to use this field when creating other charts.
Step 1: Click on the field name and select > Create > Custom Date

A new Create Custom Date popup window will appear.
Step 2: Name your new field.
Step 3: Select the level of detail in the drop-down menu.

When you select Weekdays you will see that Date Part is automatically selected. However, if you selected Years for the level of detail, you would then need to select either Date Part or Date Value to specify. If you understand the difference between those two options then it will be easier for you to make the correct selection here!

Option 2
This second option to create a custom date field is something that you can do ad hoc while you are developing your chart. In this case the field won’t be saved for you to be able to use in other charts. If you want to be able to use the same field with your specific date part or date value configuration, then you should create a custom field using the instructions listed in Option 1.
Follow these steps to create an ad hoc custom date field:
Step 1: Drag your date field to the rows shelf, columns shelf, or marks card.
Step 2: Click on the drop-down arrow on that field to open the menu.

Notice how many different options you have for how that date field can be displayed. Some of these options represent date parts and some of them represent date values.

If we want to display the weekday using date parts, then we can select the More option in the date parts section of that menu, and then select Weekday.

Quick Tip about Using Dates
If your data has dates, even if that is simply a quarter and a year, then we strongly recommend that you take advantage of all of the functionality that is available when your data is represented as a date data type. As we’ve covered here, having a date data type enables you to drill down and have numerous date part and date value options for displaying your data.
We’ve seen that sometimes analysts have year information in their data but the data type of their field is not a date data type. You can confirm whether your date field is a date data type by looking at the icon next to the field name. If you see a calendar icon then the field is a date data type. If you see an Abc icon then the field is a string data type.

If your date field is a string data type, or an integer data type (represented with a # icon), then you can and should convert your date field to a date data type. Please see the FAQ section below for more information about how to do this.
Key Takeaways and Additional Resources
We hope you have seen here that dates are a very versatile type of data in Tableau. It can be helpful to be familiar with the Tableau terminology when working with dates. This familiarity can help you more easily explore all of the available functionality. And being familiar with the functionality can help you more effectively communicate the results of your data!
If you are working with dates then you may be interested in these additional resources:
FAQ
Sometimes Tableau does not identify a date field as a date data type. Tableau may initially identify your date field as a string data type for example. You will be able to tell if Tableau identified the field as a date data type if you see the calendar icon next to the name of the field.
If you need to change the data type of your field then you can click on the data type icon next to the name of the field and select date in the menu. Depending on the format of your data, you may need to use DATEPARSE instead to convert the field. Please see this Tableau post for more information about how to convert a field to a date field.


