Call center leaders are making decisions constantly to course correct, and they need relevant analytics available to them at any moment to make those decisions well. The cost of getting it wrong is high, as you might spend much more in overtime to make up missed service levels than investing to anticipate staffing gaps in advance.
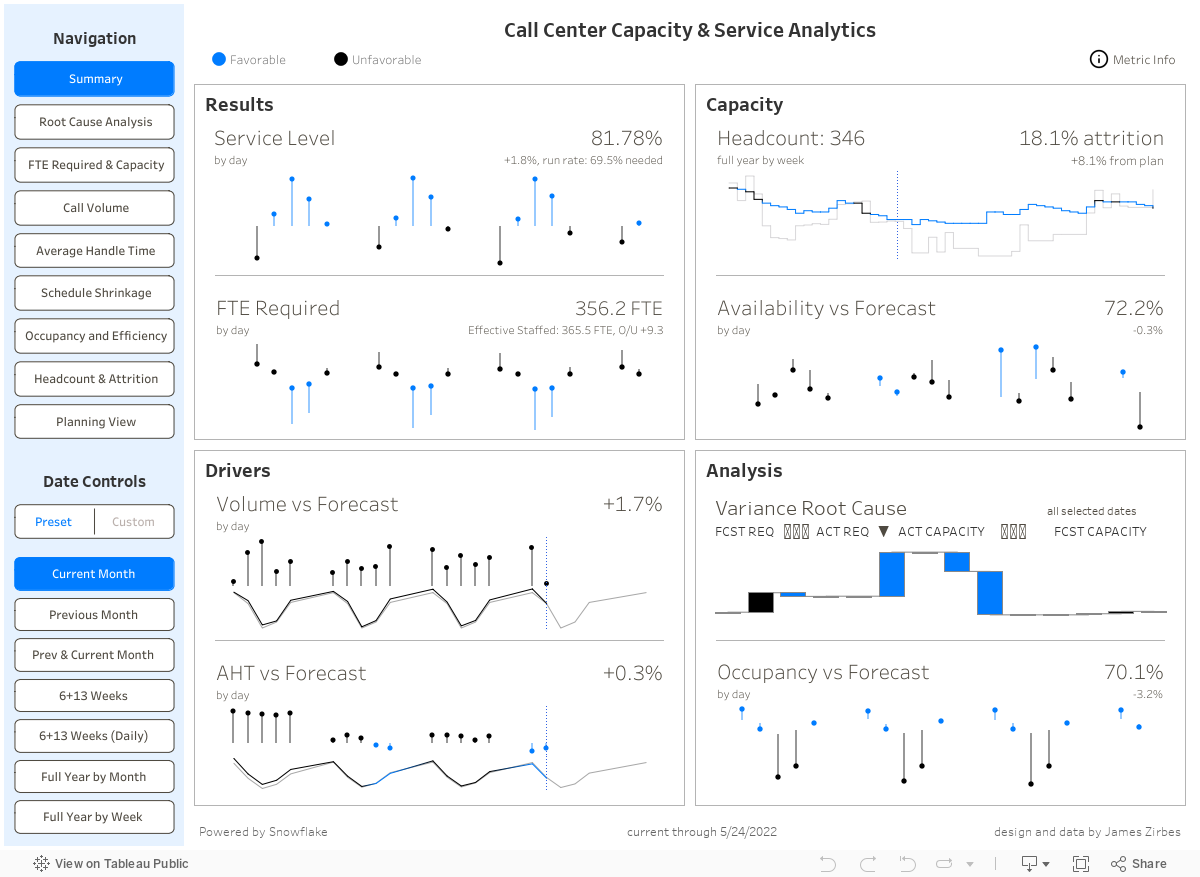
This dashboard gives insight into the service performance of a call center, its capacity and demand requirements over time, and any level of detail from the overall call center down to individual teams within it.
Analytics like this facilitate more effective communication with operations to prepare playbook strategies and build trust and agreement before those misses impact results.
About the Data
This dataset was generated from scratch by creating a simulated call center with a real staffing model. The data is integrated and modeled in the Snowflake Data Cloud and extracted by Tableau. This example call center has three physical locations, three service channels, and 15 total staffing groups between them.
Data is internally consistent and reflects the dynamics you would expect between occupancy and service level results. Your call center data may be different, but will likely have a similar structure when integrating from platform sources, and the dashboard can scale to a company of any size.
Who is This Dashboard For?
This dashboard is designed for call center operations and workforce management and planning leaders who need insights into the health and stability of their call center’s service performance.
Ultimately, this dashboard will show variance from plan and process stability across each link in the chain of the staffing model, so call center leaders can understand the quantitative causes of service performance and see and respond to future risk before it impacts results.
What You Can Accomplish With Dashboard
1. Navigation
Click on any button in the upper left to navigate the dashboard sections.
2. Metric Info Icon
Each section has an icon you can hover the mouse over for more information about the metrics and KPIs within that view.
3. Date Controls
For all views, you can select a date range preset from the list shown, or pick a custom date range and date grouping to see different levels of historical and future forecast data represented.
4. Right Side Controls
On each view except for the main Summary section, you can use the controls shown to filter and group the data at any level of the call center hierarchy, including segment, site, and individual team (if you aren’t sure what a button does, just hover over it).
5. Dashboard Sections
Summary View
This is a high-level view of current performance, with run rate calculations to show what level of future performance is needed to hit service goals.
Root Cause Analysis
This area explains how results varied favorably or unfavorably against the long-range and short-range forecasts for each component of the plan. For example, it will show the impact in required production hours that any variance in average handle time had from the plan, and how demand requirements and staffing capacity meet in the middle to reflect the actual service results for a date or period.
FTE Required & Capacity
This view allows the user to compare any combination of FTE requirements or capacity, for forecast or actual results. It shows how staffing over/unders affects service outcomes and allows the user to see where excess resources could be shifted to cover peak demands.
Individual KPI Trend Views
Navigation buttons for Call Volume, Average Handle Time, Shrinkage, Occupancy, and Headcount all lead the user to pages with the customizable trend and variance charts for each respective metric and any related KPIs.
Planning View
This dashboard section has all the metrics a call center might need in detail in one spot. Click any value to see that metric’s trend visualized below, and export the data quickly with the button at the top.
Other Notes:
Your call center may focus on slightly different performance metrics, like average speed of answer (ASA) and abandonment rate, so this could be tailored to meet your particular objectives.
In Summary
This dashboard provides must-have analytics and insight for any call center. If you are being asked to do more with less, you need analytics tools like this one to identify opportunities and strategies to be more effective with your resources, as well as communicate effectively and quantitatively to ensure you can source the staffing and resources you really need to be successful.
We hope you have found this dashboard example useful in your pursuit of service excellence for your organization. If you have any questions, need help, or are interested in having a team of Tableau and Snowflake experts design dashboards for you, please reach out!