This post is the fourth in a series of posts examining a whole host of game-changing Tableau Desktop features that have been released in 2020. In the last post, we discussed the nuances of Set Controls. In this post, we will dive into Relationships, which were released in Tableau Desktop 2020.2.
We have already written about this topic in a previous blog post, but that was more theoretical. Instead of talking about the concept of relationships, this blog post is going to show you how to implement them in your dashboards and what they mean for your data model.
What are Relationships?
When building a data model you generally have two approaches, flat files or relational models.
Flat files are when you have all of your data in one file with every row receiving some value in every column, and every data attribute you need is in that large layout.
Relational models use STAR schemas where you define relationships between your fact and dimension tables without joining the values into one file and then using those dimension tables only when needed to describe the fact table.
In the image below, I pulled the Sample – Superstore data set from Tableau 2019.4 and created the joins necessary to bring in all of that data. Circled in red you can see that the data from the different tables are being joined into oneflat file, aka all the data from those tables is being combined into one table or view.

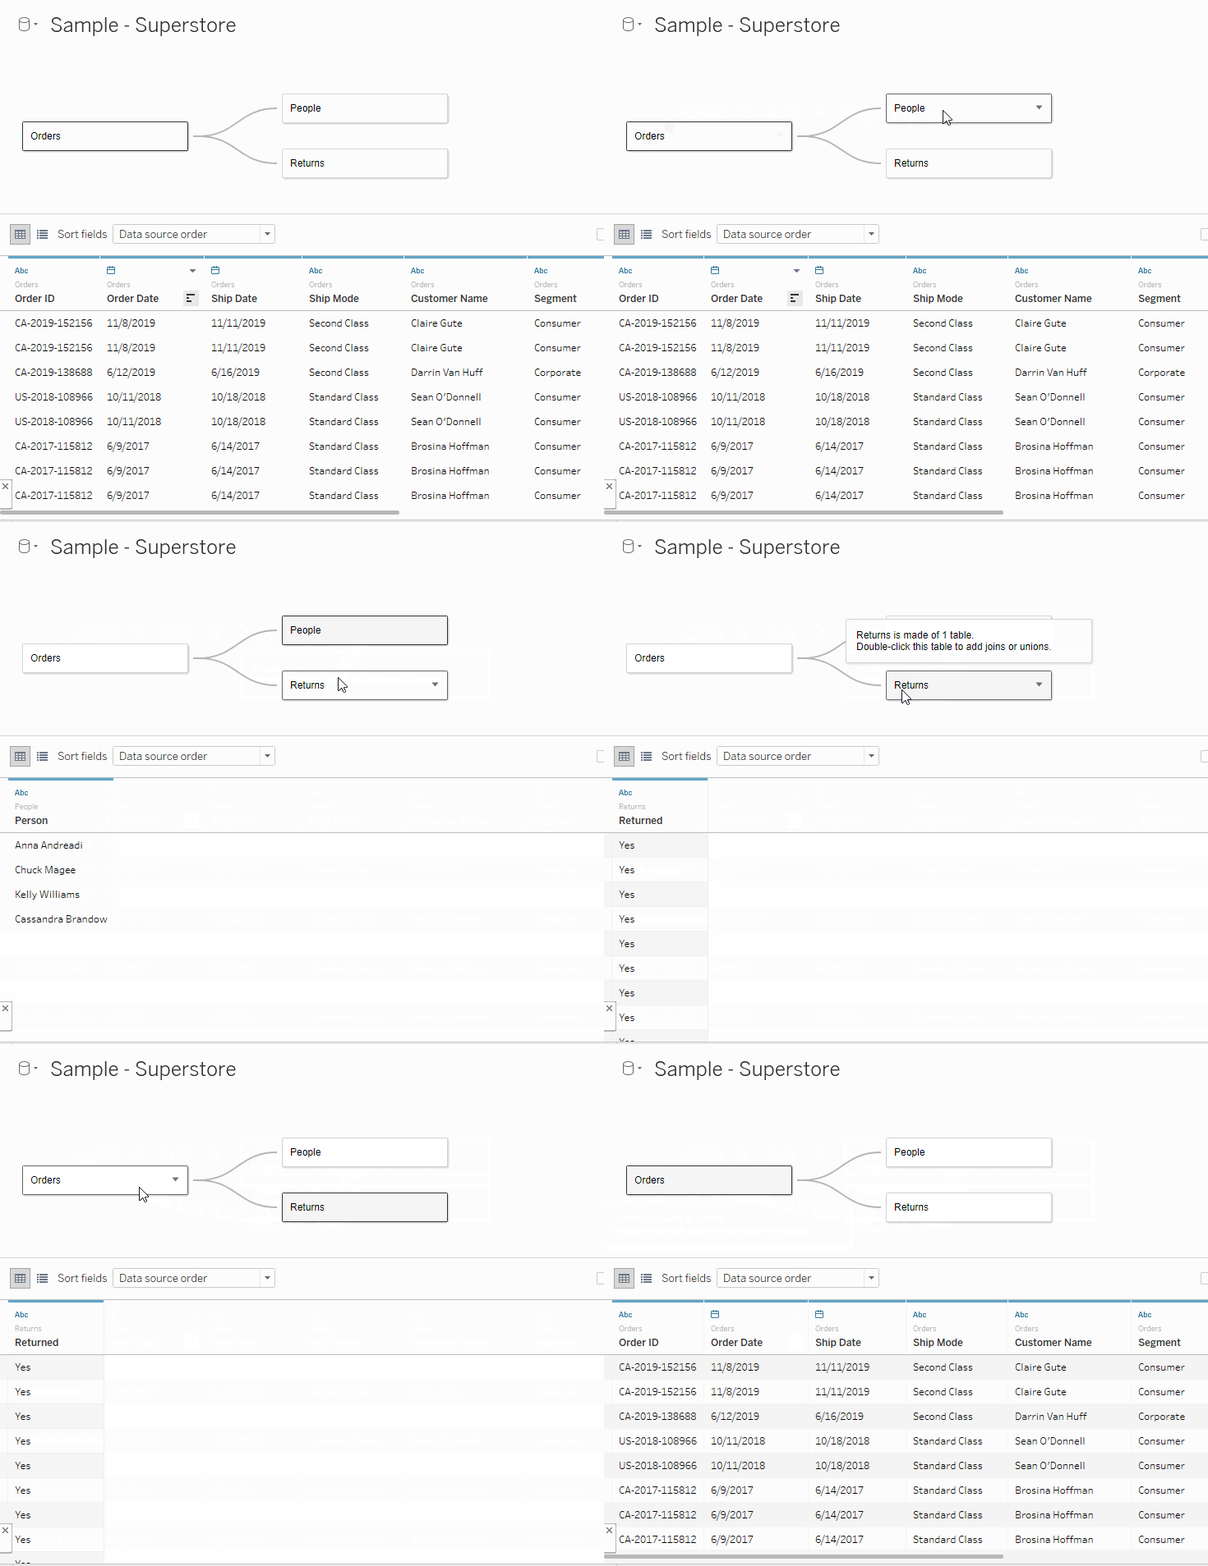
See below for an example of the new relationship model. You can see that as you click on each of the different tables that they show up individually in the preview pane. This is because they are not all joined together, they are related. The only time that multiple tables are referenced in the same query is when a query goes across a relationship.

How To Set Up a STAR Schema
Relational data models use STAR schemas to create an efficient and optimized way of storing and retrieving data. STAR schemas are made up of fact and dimension tables.
Fact Tables – these tables describe the measures or metrics pertaining to some sort of business process. The columns in these tables will either describe the business process or it will contain fields that relate to dimension tables that will further describe elements of the business process.
Dimension Tables – these tables will provide descriptor fields for the columns in your fact table that were not necessary for describing the business process. The columns in this table should focus on providing more details about whatever field is the primary key.
Identifying your fact and dimension tables is an important first step in creating your relational data model. The next step is to create the proper relationships between your tables. See the example below where we have our Sales_Fact table and two related dimension tables.
You then need to determine the cardinality of your relationships. Cardinality of a relationship is the relationship between the number of rows in one table and the number of rows found in the other table. Let me give you an example.
The Sales_Fact table to the right is going to have many rows with each region present. The Region_Dim table will have one row that describes that reason. The cardinality of this relationship is referred to as one-to-many.

You can also have relationships that are one-to-one or many-to-many. You will not only need to know the cardinality of your relationships for the purpose of building your data model, but you also must understand this relationship in order to correctly use your data to build out your analysis.
The last concept you must understand to complete your data model is to understand your relationship’s referential integrity. This refers to the quality of the relationship between two tables. If every value found in your fact table is found in your dimension table, then the two tables are assumed to have referential integrity. A lack of referential integrity in your relationships will disrupt your data model and can cause inaccurate and/or misleading reporting.
Building a Relationship in Tableau
Now that we’re refreshed on the basics of data modeling and relationships, let’s build out our data model using relationships in Tableau!
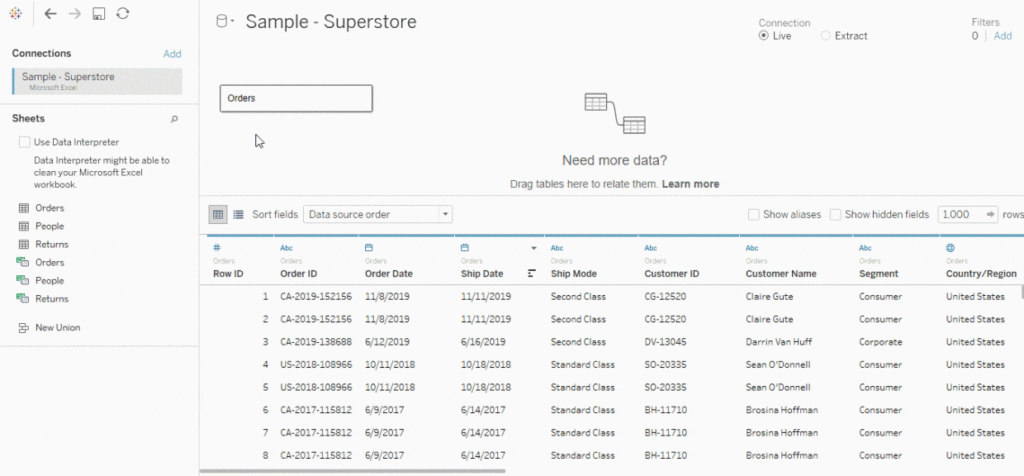
I am going to use the Sample-Superstore data set in Tableau 2020.2 to create our data model. First, let’s identify our fact table. Here, the Orders table is our fact table because it describes our business process. We want people to order items from our Superstore, and when they do, they are recorded in the Orders table. Drag on the Orders table.
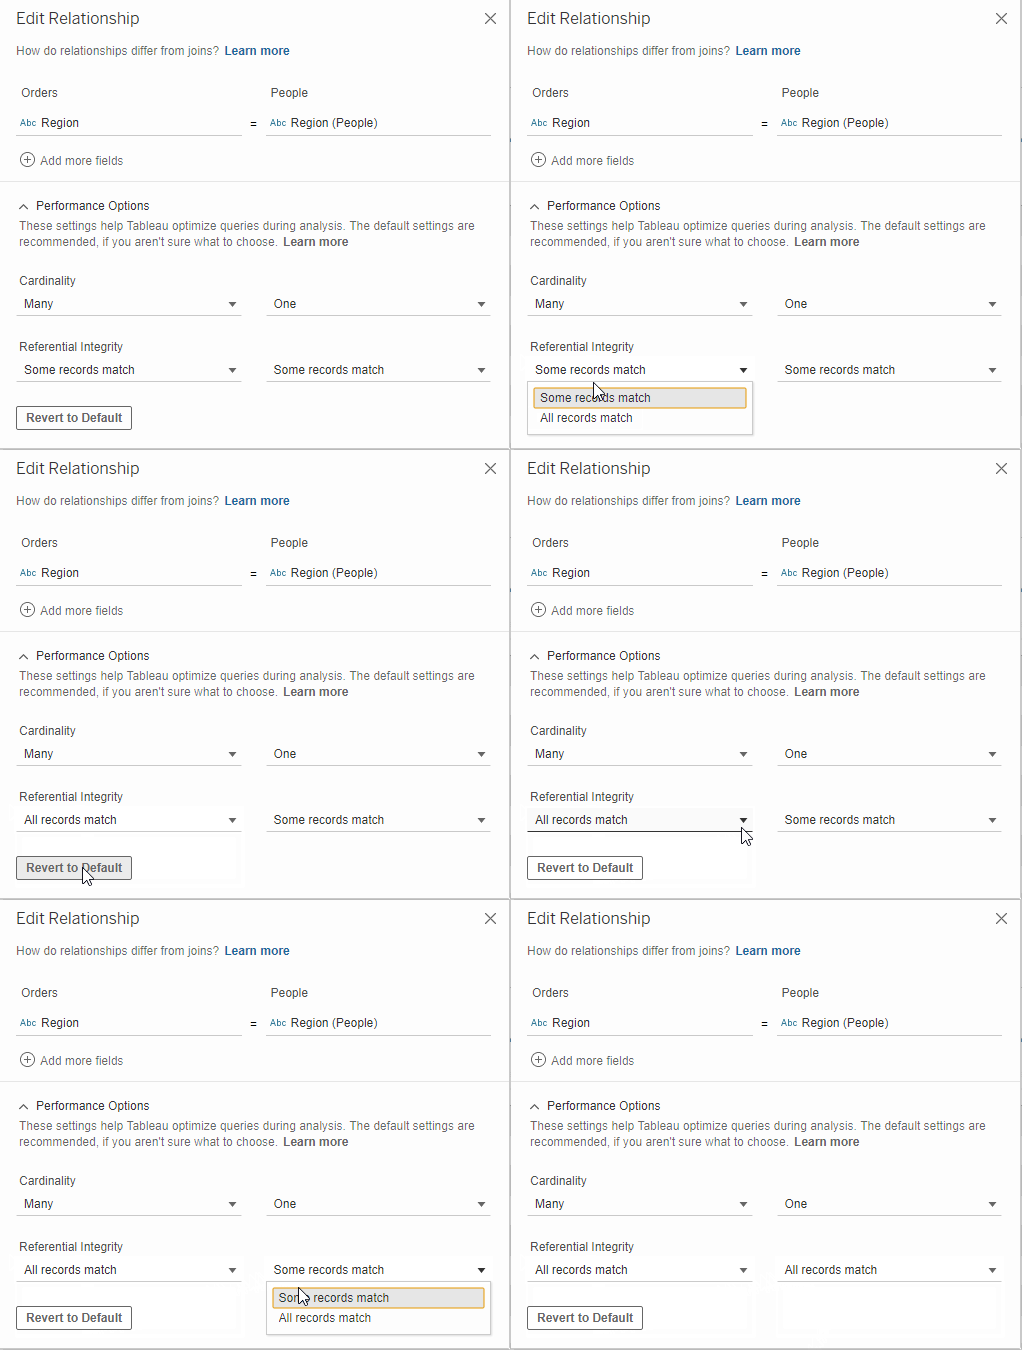
Next, let’s describe elements within that fact table with one of our dimension tables. Drag thePeopletable onto the pane. The menu below will pop up. This is where we will define the characteristics of our relationship.

When I brought in the People table, Tableau recognized that there was probably a relationship between the Region field from the Orders table and the Region field in the People table. If this had not been the case, then you would have needed to select the fields from the drop-down that you want to relate.
Next, you will need to select the cardinality for this relationship. Here, there are many rows with each region in the Orders table but there is only one row per region in the Region table. This means the cardinality is many-to-one. Choose those options from the drop-down accordingly.

Last, you will need to choose where your relationships will hold its referential integrity or not. If you do not know whether every value has a match, then choose Some Records Match. If every value is your field will 100% for sure have a match in the field it’s related to, then you can choose All Records Match.
Now that we’ve set up our initial relationship, let’s bring in the Returns dimension table and set up a relationship to the Orders fact table. In this example, there are many rows in your Returns dimension for each order just as there is in the Orders table, so it will be a many-to-many relationship on the Order ID field. Although I assume that because an order got returned, that it was ordered, I am still choosing Some Records Match because I am not entirely familiar with the data.

Once you’ve created your relationships, you are now ready to build your report! When you go to your first sheet you will see each of the tables in your relationship grouped together in the Tables pane on the left-hand side.
Can I Still Join Data?
Although relationships are generally better to use (as we’ll discuss in our next topic), this does not mean that joins are not possible.
To create a join, drag your first table into the empty pane, then double-clickon that table. When you double-click, it will look like the selected table popped out into a separate container with a border around it. Once you’re in this view, you can drag in your desired tables and create joins in the same way you would have previously in Tableau. See below for an example.

Why Are Relationships Better?
Although we’ve already covered why relationships are better for your data model in a previous blog post, let’s recap why you should use relationships and STAR schemas instead of joins.
Data Storage – instead of storing your data with every detail about every column in a flat file form, STAR schemas call for you to store fact tables and dimension tables separately. This will limit the amount of data that you’re storing. For example: you have a sales table with 5 columns, one of them being region, with 100k records. You also have a region table with 5 columns and 5 records. Storing them together means you could have 5 extra columns for every 100k rows in the fact table or 500k more data elements that you would have to store.
Query Efficiency – when querying data on a flat file, every row of the expanded data set will be included in your query. When creating queries in a relational data model, only the tables that are involved in the query or calculation are referenced. For example: if your data model has Sales_Fact, Region_Dim, and Country_Dim tables, if you were to query the total sales by Region, then all fields in your Country_dim table will be excluded which streamlines your query.
Scalability – using flat files to scale out data models across large enterprise solutions can cause slow performance, increased stress on your database, and inability to easily locate required data. Using relationships can allow you to scale your data model especially when you’re using large data sets.
Although there are lots of advantages of Relationships, there are some things you should be aware of when transitioning from a flat file.
Ease of Build/Use – compared to using flat files, data relationships can be more confusing for people to understand and use when building out metrics. You can often find errors in your flat file much easier than in a relationship because you can literally see every outcome of your join in the data set in front of you.
Overall, relationships are a HUGE upgrade for Tableau and its users. Although it’s not as sexy as Set Actions or Buffer Calculations, the effect that relationships will have on everyday business users is immense.
Do you have more questions about Tableau? Talk to our expert consultants today and have all your questions answered!


