Sometimes you need to include custom shapes for your visualizations.
One useful trick in Tableau is including a completely transparent, single-pixel image as a shape on dashboards and worksheets. This shape is extremely versatile and underutilized. When hovering over the shape, the end-user is unable to highlight or select the shape. In fact, the single-pixel transparent .png can be used as a placeholder:
- In combination with arrows showing direction (by showing no direction).
- For missing data (or when a value may not be relevant)
- To assign to false values in a boolean
- To show deselected values in a parameter or set
- As well as a few others.
This blog post outlines six example of how to use the transparent shape.
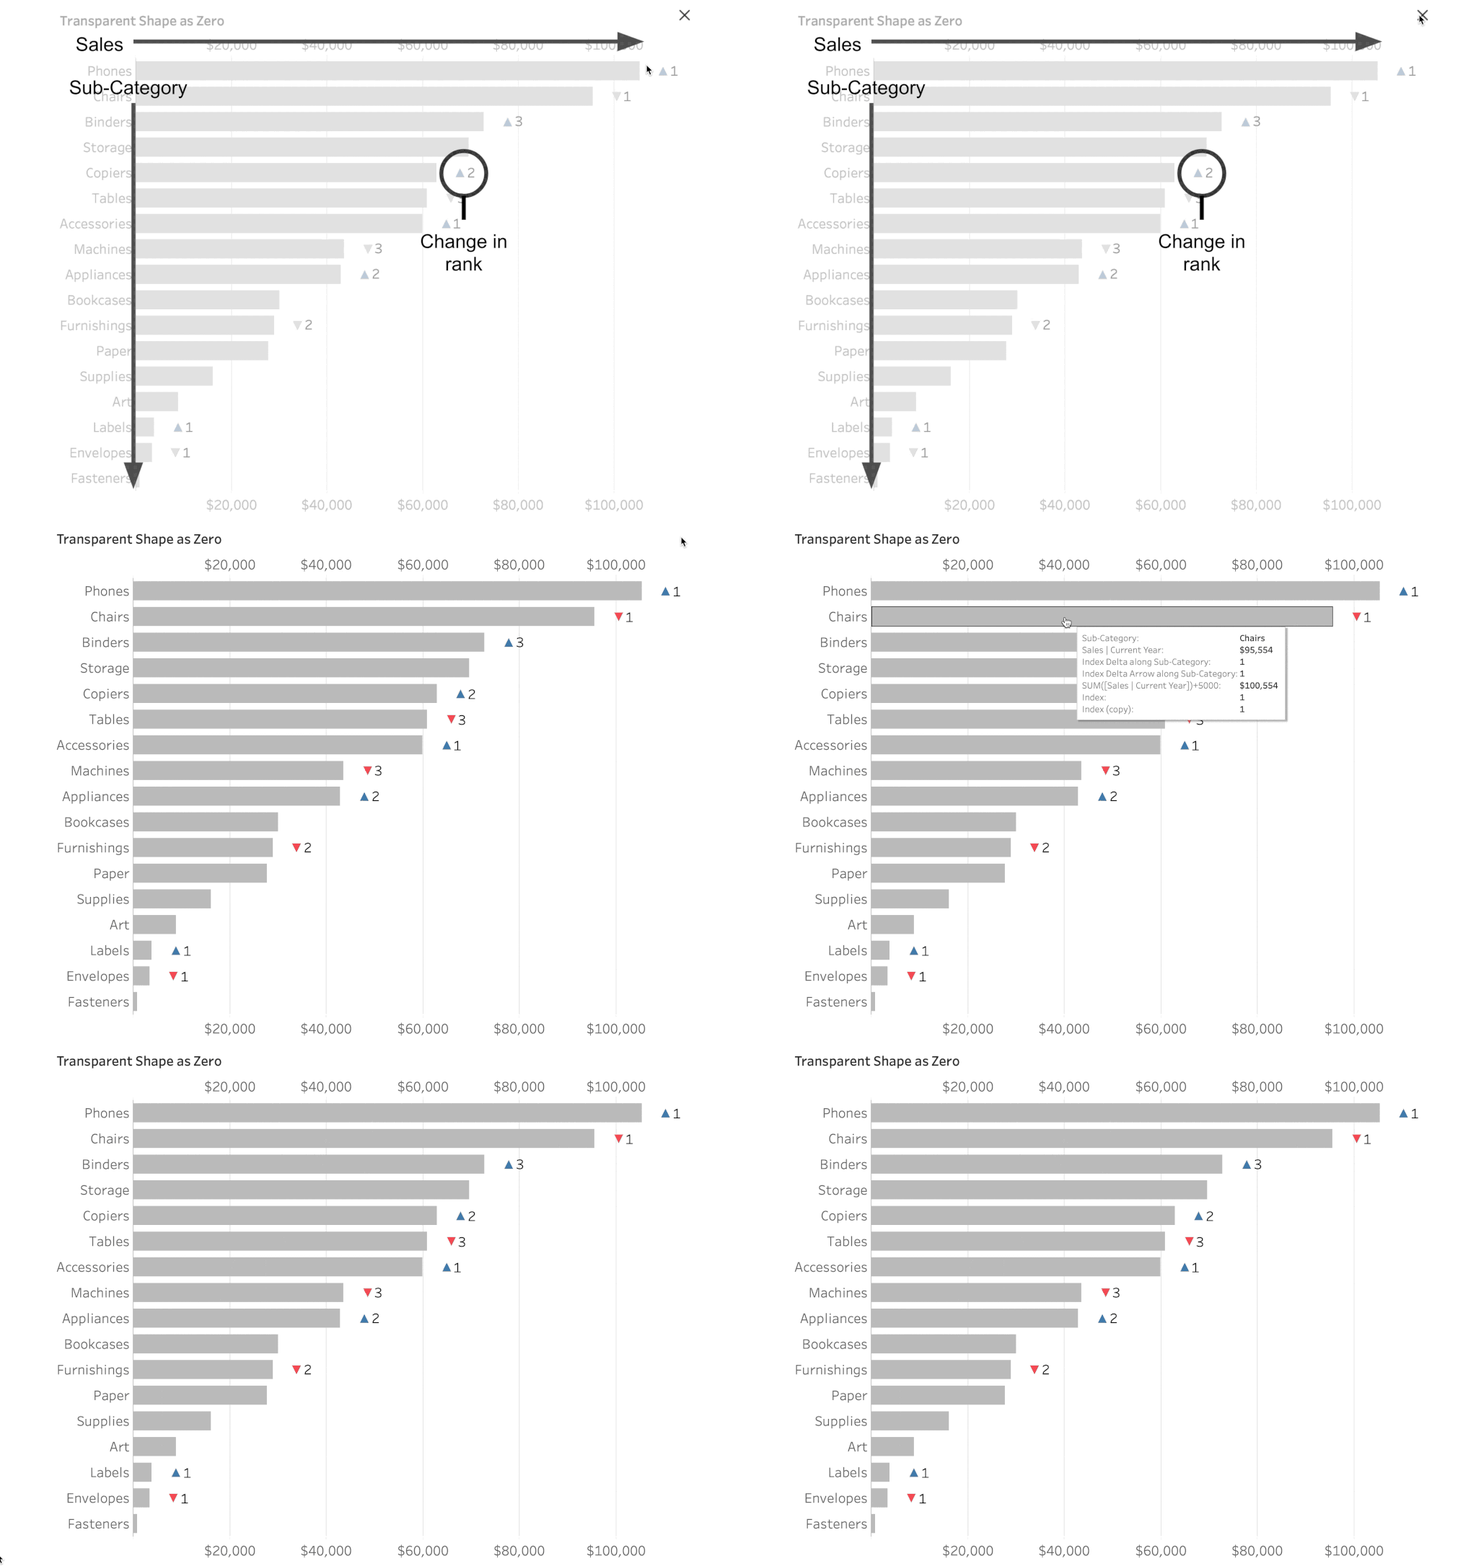
Example #1: Values with no change
Sometimes when showing rankings I have values with no change. When I’m showing a change in rank of 0 these values I like to use a transparent shape.

Example #2: Values outside of set of criteria
In this example, I have criteria for competitors’ names to show if they are at the top and have more than 30% of the overall market. Sometimes I use side-by-side charts but for this example, I’ve put it all on one chart. Then I show the logos of the main competitors. If there is not a main competitor meeting the criteria they are assigned the transparent custom shape.

Example #3: When a value is equal to a parameter
Whether with a bar chart as an indicator or as custom drop-down, I sometimes use a custom transparent shape to highlight the value selected.

Example #4: When values are in a set or group
When I have values in a set or group and I want to show a color indicator, I sometimes use a transparent shape.

Example #5: Transparent shapes for values that are FALSE in a boolean
Sometimes I just want indicators for when something is above (or below) a threshold. In this case I can use transparent shapes.

Example #6: One-time alerts or instructions before proceeding
Sometimes I provide instructions or an alert about the data to my audience. I’ll place the content inside a floating container, then use show/hide. I’ll set the default value to show and then I’ll change the transparent image to the hidden button. This way it can’t be found again.

These are just a few ways to use the transparent customized shape. Hopefully, it’s been informative. If you have any questions, please feel free to reach out.


