

Dashboards are crucial for businesses to understand their performance. It’s better to keep the dashboard clean by having only the necessary and less number of components. A good dashboard is always easy for end users to interact with.
That’s where Parent Controls in Omni Analytics make a difference. This feature will help you build cleaner, more intuitive dashboards.
In this blog, we’ll explore why parental control matters, how to implement it, and how we can enhance our dashboard experience. By the end, you’ll be able to create parent control to reduce the number of controls in a dashboard.
What is Omni Analytics?
Omni Analytics is a Business Intelligence platform that’s known for delivering fast, self-service analytics while ensuring data consistency and governance. It is designed to bridge the gap between the data team and business users.
Why Choose Omni?
Easy for Everyone: Omni is a simple and intuitive interface that makes data analysis accessible to even non-technical users. It provides different ways to interact with data, like point-click, Excel-like formulas, and SQL
Self-Service Analytics: A spreadsheet-like interface enables business users to interact with data and build reports on their own. It will reduce the dependency on the data team
Seamless Data Connections: Connect to multiple sources effortlessly with built-in integrations. Omni helps you to maintain data consistency across multiple dashboards with the help of the semantic layer
For a deeper dive into Omni’s features and architecture, we recommend reading this blog: Omni Analytics: What You Need to Know.
What is Parent Control in Omni, and Why Does it Matter?
A Parent Control in Omni Analytics serves as a master switch, governing multiple related controls on a dashboard. Instead of requiring users to interact with multiple individual controls, Parent Control enables you to link them and manage them from a single, unified interface.
Think about this common scenario: You have two separate controls on your dashboard. One lets you switch a chart between Current Year Sales and Current Year Profit. The other option allows you to switch between the Previous Year Sales and the Previous Year Profit charts. If you want to compare Sales year-over-year, you currently have to flip two separate switches.
Parent Control solves this. We create a Parent Control to link these two child controls. Now, we will create a parent control “Select Metric”, the user chooses “Sales,” and both charts instantly update to show sales data for their respective years.
Parent control improves the dashboard user experience. It helps to have a cleaner dashboard.
How to Implement Parent Control in Omni
Let’s start with how to build parent control.
Step 1: Identify and Configure the Child Controls
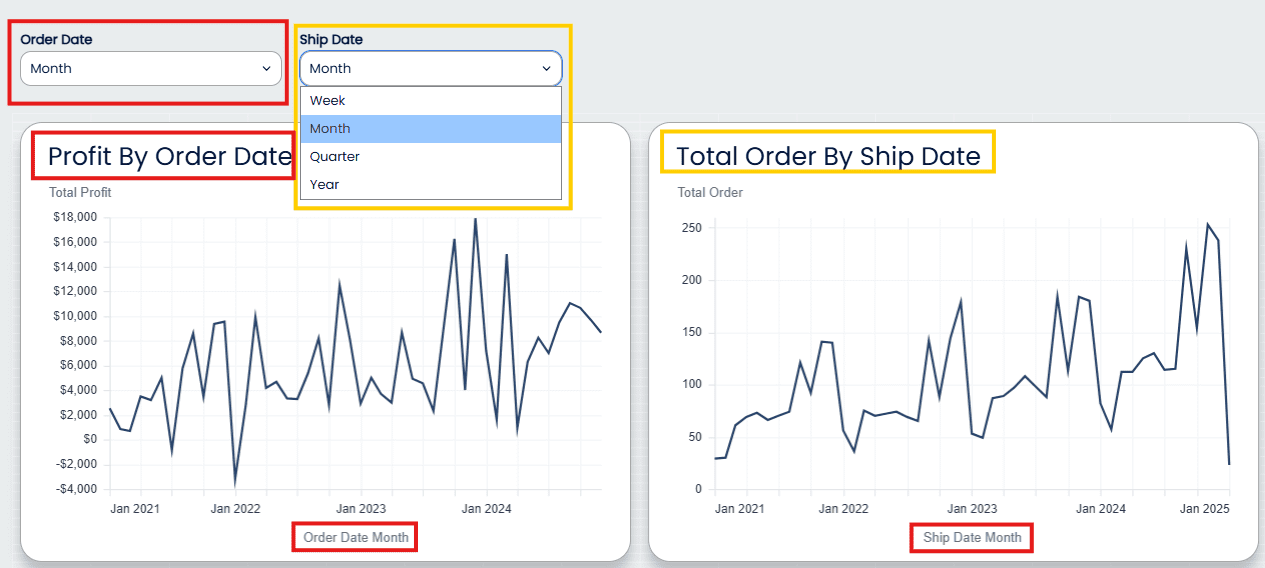
Add two Time Frame Switchers: one for Order Date and one for Ship Date. Each offers options for Week, Month, Quarter, and Year.
Problem: Without a parent, to view the Monthly for both charts, a user must set the Month twice.
Goal: Use one Parent Control to sync both Time Frame Switchers with a single selection.
Step 2: Add the Parent Control
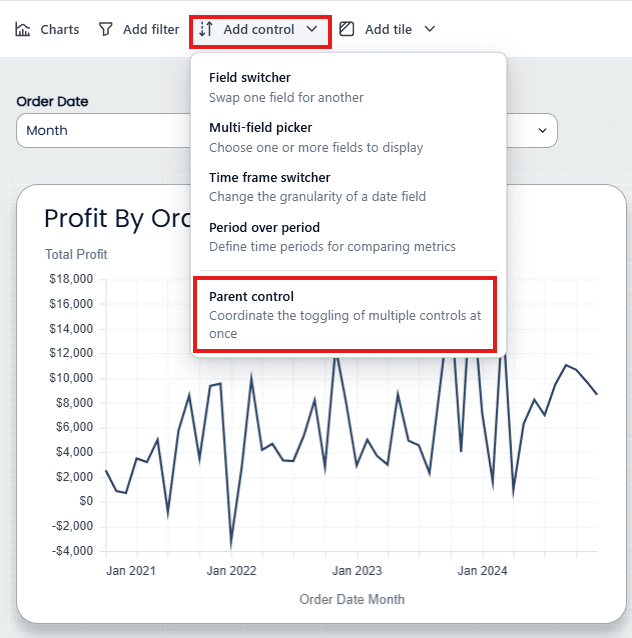
Once we have configured and placed our two individual Time Frame Switchers (the “child” controls) on the dashboard, we are ready to introduce the parent control.
From the dashboard menu, click Add Control and then select Parent Control from the list of control types.
Step 3: Define the User-Facing Options
In Edit Control, set Label (e.g., “Select Time Granularity”) and an optional Description.
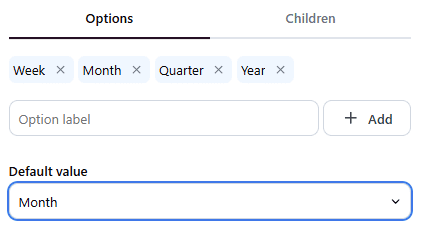
Options: add Week, Month, Quarter, Year.
Set a Default value.
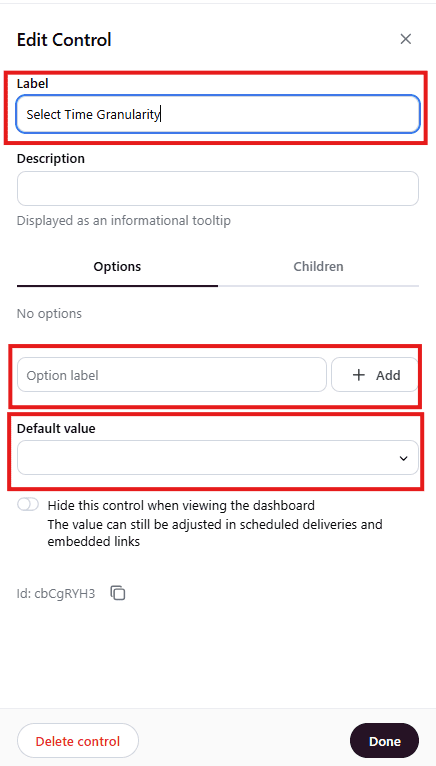
Like this:
Step 4: Map the Child Controls to the Parent Options
-
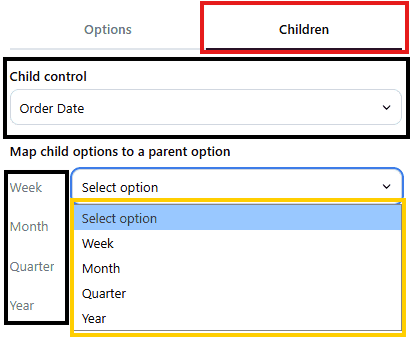
In the Edit Control > Children options, select the first child: Time Frame Switcher [Order Date].
-
Map Week → Week | Month → Month | Quarter → Quarter | Year → Year.
-
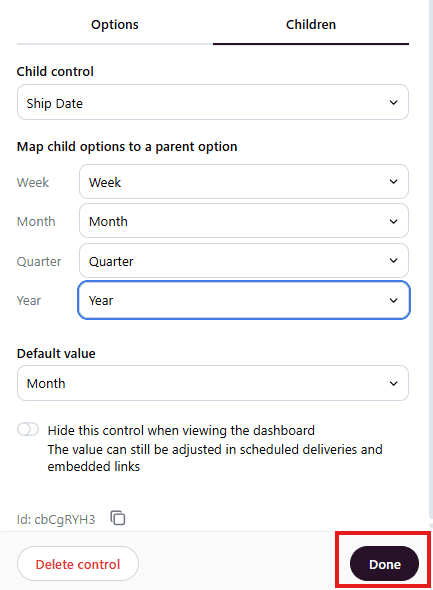
Repeat for the second child: Time Frame Switcher [Ship Date].
Quick mapping checklist:
-
Parent: Week → Order Date: Week; Ship Date: Week
-
Parent: Month → Order Date: Month; Ship Date: Month
-
Parent: Quarter → Order Date: Quarter; Ship Date: Quarter
-
Parent: Year → Order Date: Year; Ship Date: Year
Step 5: Finalize and Test
Click Done, exit edit mode, and confirm that one selection updates both charts simultaneously. Hide the child controls for a cleaner view.
Use Cases for Parent Control
1. Synchronizing Multiple Field Switchers
In one of my previous projects, we built a dashboard to analyze sales performance across multiple years. The visualization was a line chart designed to show trends over time.
The Problem We Faced
The complication arose from the data source, where six separate measures were calculated in the backend:
Demand Sales TY, LY, LLY (This Year, Last Year, Last-Last Year)
Net Sales TY, LY, LLY
The user needed the line chart to display a comparison of TY, LY, and LLY at all times, but they had to be able to switch the entire set of three lines between Demand Sales and Net Sales.
If we had tried to solve this with standard controls:
We would have had to use three different Field Switchers, one to select the TY measure, one for the LY measure, and one for the LLY measure.
To switch the chart from showing all Demand Sales to all Net Sales, the user would have had to click three separate Field Switchers, ensuring they correctly toggled each one. This was prone to user error and created a cluttered interface.
The Parent Control Solution
This was the ideal application for the Parent Control.
Child Controls: We first implemented the three necessary Field Switchers (one each for TY, LY, and LLY). Each one was configured with two options: the corresponding
Demand Salesfield and the correspondingNet Salesfield.Parent Control Orchestration: We then introduced a single Parent Control named “Select Metric Type”. It had just two buttons: “Demand Sales” and “Net Sales”.
The Result: When the user clicked “Net Sales” on the parent control, it simultaneously orchestrated the following three actions:
Set the TY Field Switcher to
Net Sales TY.Set the LY Field Switcher to
Net Sales LY.Set the LLY Field Switcher to
Net Sales LLY.
2. Managing Time Period Selections
The Scenario You Face
Your Customer Acquisition dashboard relies on multiple date fields. For example, you have a line chart showing new customer accounts by their created_at date and another chart tracking all orders by their purchased_at date. You need your users to be able to switch the analysis for both charts simultaneously (e.g., from Week to Month to Year granularity).
Why Parent Control Helps Your Team
You could set up two separate Time Frame Switchers, but this would increase the number of clicks, and you might have different charts showing different granularities of data, which could cause confusion.
Instead, we configure individual Time Frame Switchers for both the created_at and purchased_at fields, and then link them to a single Parent Control. Your user only needs to interact with the Parent Control (e.g., “Select Timeframe Granularity”), and both visualizations will update their time frame instantly. This is far more efficient than requiring your team to change two different date controls, ensuring consistency and saving valuable analysis time.
Best Practices
Better Dashboard View
Once you create a Parent Control, we recommend hiding the child controls on the dashboard for a cleaner, more professional view. This is the final step that transforms your dashboard from a complex “control panel” into a simple, high-level interface.
How to Achieve This:
While in edit mode, select one of your child controls (e.g., the Time Frame Switcher for Order Date).
In the Edit Control form that appears, simply enable the option: “Hide this control when viewing the dashboard”.
Repeat this process for all controls linked to the Parent.
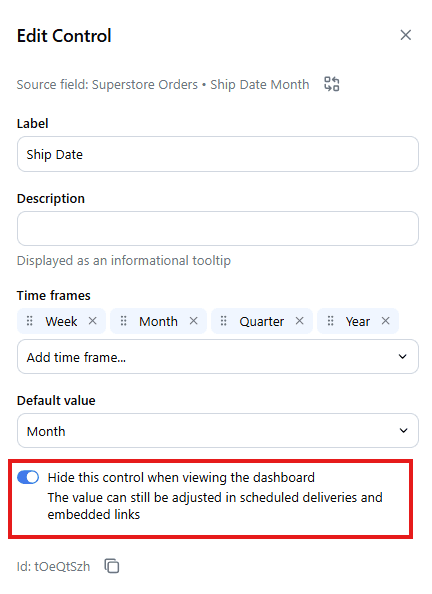
Note: Control will be hidden when you view the dashboard, not while editing it.
2. Dynamic Text Tile
When you implement a Parent Control, you’re making your dashboard dynamic; your charts change based on a user’s single click. To give your users immediate, unambiguous context, it’s best practice to use dynamic headings for your charts.
How We Achieve Dynamic Headings
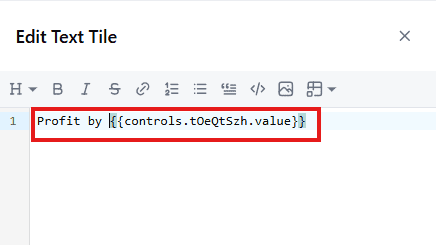
Get the Parent Control ID: While editing your Parent Control, locate and copy its unique ID.
Use a Text Tile: Create a new Text Tile above the chart you want to contextualize.
Apply the Mustache Syntax: In this Text Tile, use the following syntax, substituting
idwith the actual ID you copied:
Analysis for: {{controls.your_control_id.value}}
The {{controls.id.value}} snippet tells Omni to pull the currently selected value from your Parent Control.
Closing
We’ve seen that standard controls are excellent for applying one condition across multiple charts. However, when dealing with the real-world complexity of synchronizing multiple metric fields, time frame switchers all at once, as we did in the six-measure project scenario, the Parent Control becomes essential.
Try to eliminate the extra controls that don’t aid your analysis. Start using Parent Controls to transform your data visualizations from a jumble of options into a streamlined source of truth.

Ready to level up your dashboards?
Contact phData to schedule a quick working session and implement Parent Controls the right way.
FAQs
What are Templated Filters in Omni Analytics?
Templated Filters are another powerful way to streamline reporting and create dynamic, user-specific dashboards without writing complex SQL. Learn how Templated Filters streamline reporting.


