The Fraud, Waste, and Abuse (FWA) Tableau Dashboard provides organizations with an overview of application trends, metrics, details, and potentially fraudulent activity.
Monitor and prevent instances of fraudulent, wasteful, and abusive activities. Detect unusual patterns to aid resource allocation, monitor compliance, and promote transparency around FWA prevention efforts.
Each organization is unique, so they will need to analyze prior data periods to establish their own KPI thresholds and other indicators for tracking fraud and adapt the dashboard accordingly.
Who Is This Dashboard For?
The FWA dashboard is designed for organizations that want an overview of FWA activity. The dashboard can be applied across various sectors, including healthcare, finance, government, insurance, and more.
The dashboard serves multiple stakeholders, from management and executives to risk management teams, audit and investigation units, data analysts and IT teams, regulatory authorities, and more.
These dashboards monitor activities to prevent fraud, identify suspicious patterns or behaviors, provide insight into applicant details and activity, and support organizations to allocate appropriate resources and make informed decisions to prevent financial losses.
What You Can Accomplish With Dashboard
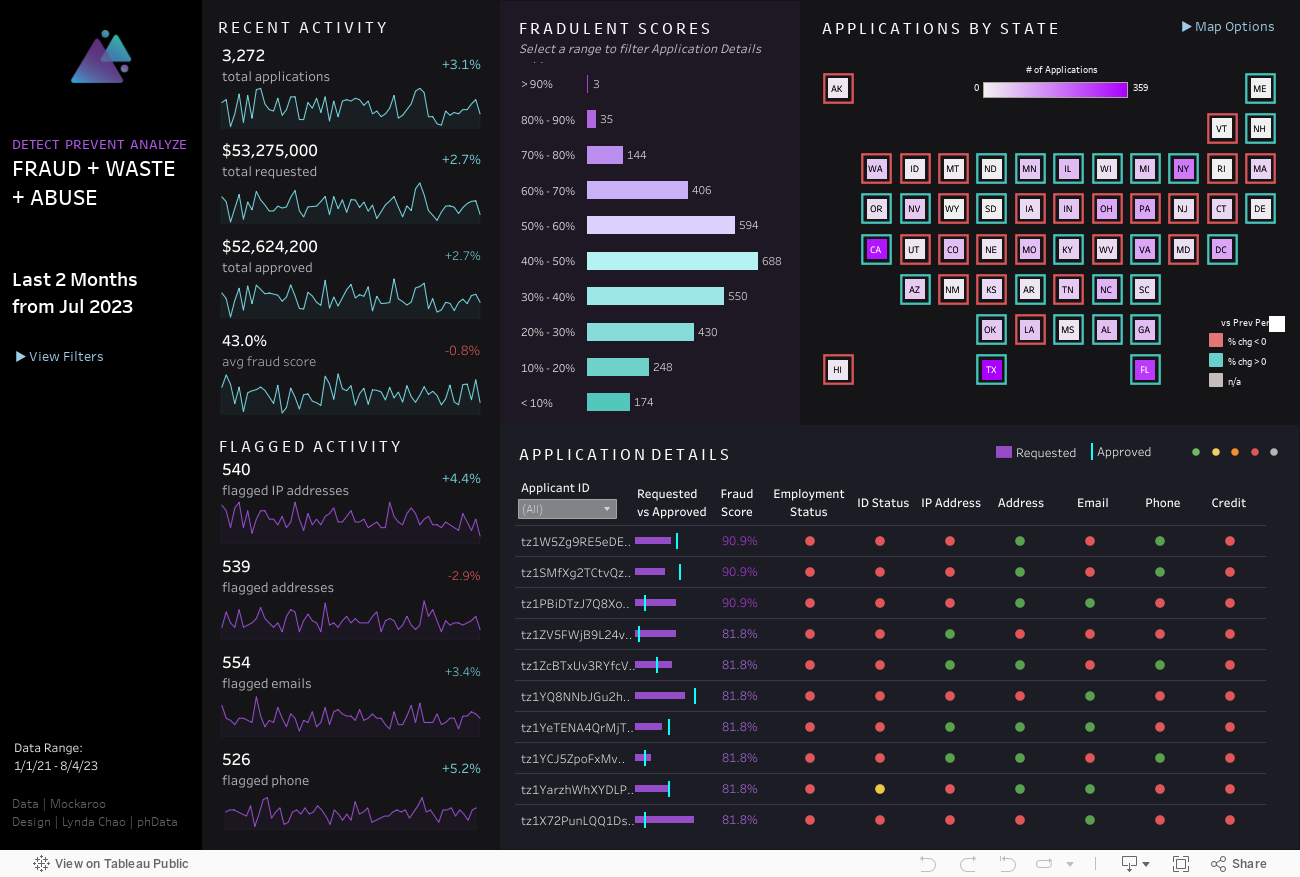
Users can view overall trends around the number of applications, amount requested, amount approved, average fraud score, flagged activity such as suspicious IP addresses or phone numbers, breakout by state, and a detailed table of applicants and their potential fraudulent scores.
Additional features include:
Filter Menu: Users can expand the filter menu in the left column, where they can select the month year, how many last n months, the date level for the trend charts, choose application type, and filter by state.
Date Selection Parameter: Users can select the specific month and year they would like to view the data by and input the last N months from the month year selected.
Flexible Trend Chart Date Levels: Depending on the last N months entered, users can switch the trend chart’s date level to be displayed as daily, weekly, or monthly level.
Tile Map: Users can switch between viewing the tile map by number of applications or fraud score by clicking on “▶ Map Options” The tile map was created using a separate CSV to create the tile effect.
Application Details Table: Provides detailed information for each application ID and their score for each indicator that contributed to the fraudulent score.
Fraud Score: The example fraud score in this dashboard was calculated by giving each fraud indicator a certain number of points, then adding all the points for each applicant and dividing it by the total number of possible points to determine the % potential fraudulent score for each applicant.
The metrics in the dashboard serve as an example of indicators that can be used. Adapt the dashboard to reflect your business needs, priorities, and thresholds for tracking potential fraudulent behavior.
Conclusion
We hope you found this dashboard useful in your pursuit to detect, prevent, and analyze FWA activity at your organization! If you have any questions, need help, or are interested in having a team of Tableau experts design dashboards for you, feel free to reach out!