
Customer's Challenge
A major US restaurant chain needed to migrate many key Tableau workbooks from an old data source to Databricks and re-tune four key Tableau dashboards to accommodate its growing scale. They also needed help narrowing down the scope of their highly granular data and implementing best practices in Tableau around data modeling, row-level security, and dashboard design.
phData's Solution
phData implemented a quick 9-week project to migrate 12 Tableau workbooks and to optimize another four key dashboards. Several data sources were reduced in size by as much as 90% without loss of dashboard functionality. In comparison, others were performance-tuned within Tableau to see a major reduction in dashboard processing time (up to 70%).
The Full Story
A major US restaurant chain had useful existing Tableau dashboards that had grown in size to become unruly with poor performance–some took 30 seconds or more to load. At the same time, the restaurant chain needed help and guidance migrating their Tableau data sources from one database to Databricks for the first time. Luckily, phData was able to vastly improve the performance of 4 of their least performant dashboards and to migrate an additional 12 dashboards to Databricks, all within 9 short weeks.
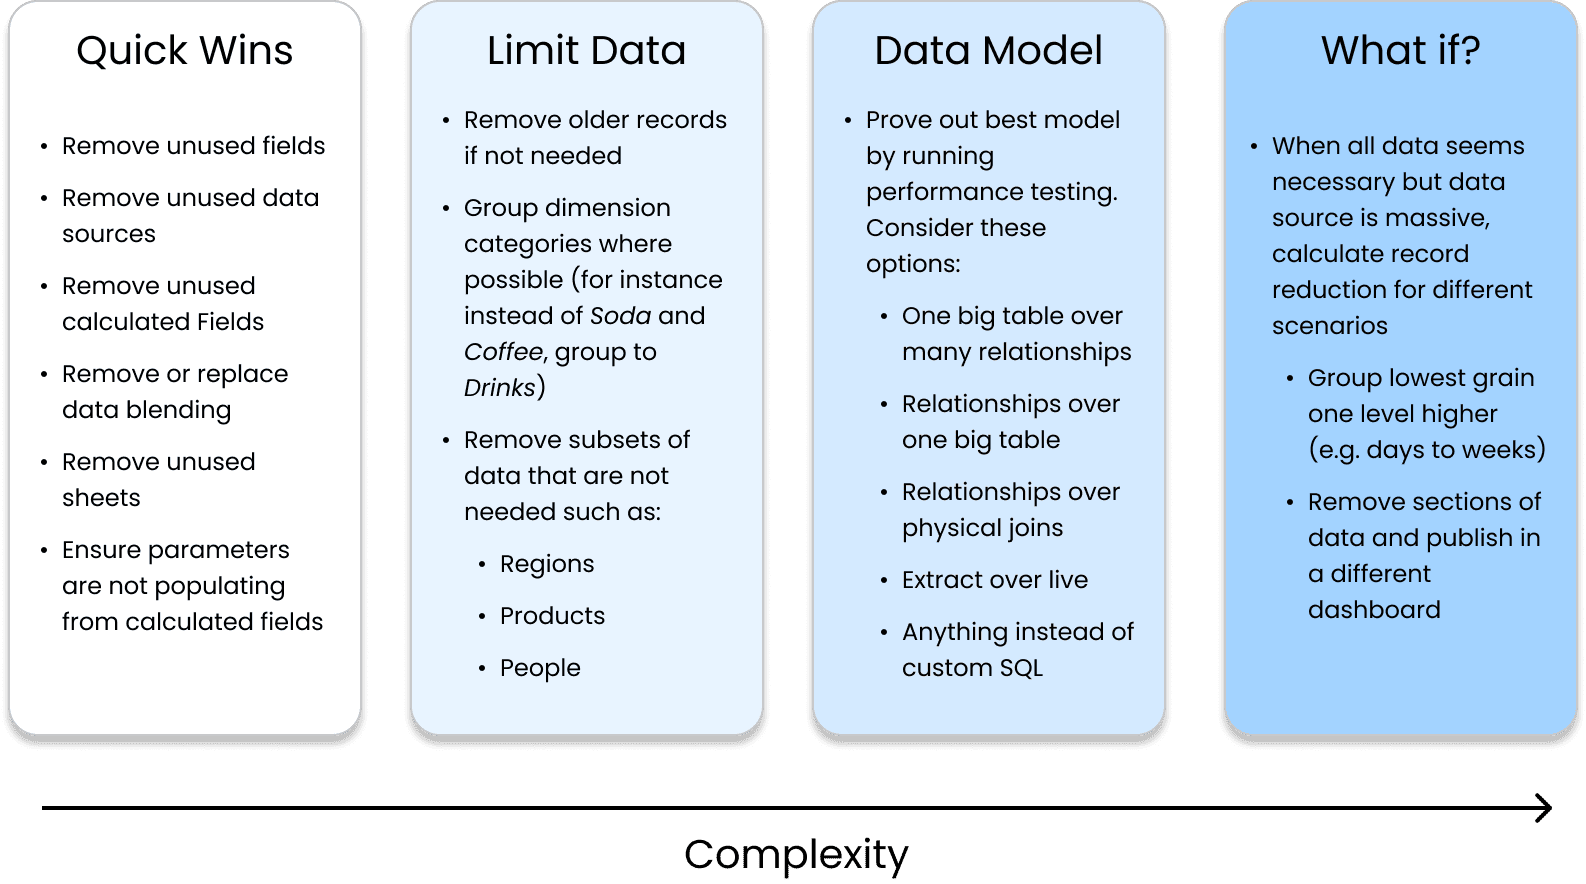
So, how exactly did phData improve these 4 key Tableau dashboards? While there is no magic formula, our Tableau experts have a wealth of experience with various clients, a firm grasp of the tool, and a fresh perspective to bring to any company looking to make dashboard improvements. Some of the things we look for include:
Quick Wins
Running Tableau’s out-of-the-box Workbook Optimizer tool led us to find some easy problems to fix in a few of the workbooks in this project. Some of these were simply hiding unused fields, removing unused data sources or sheets, and removing unnecessary data blending.
Other quick wins were found through our expertise. For instance, one workbook used a calculated field to populate a parameter–a huge performance lift for the size of the data source in question (>100 million records). By replacing this calculated field with a native one, we reduced the median runtime from 26 seconds to just 7.6 seconds.
Removing Unnecessary Data
Often, a data source in Tableau will have more records or columns than is needed for the desired end product. For instance, in this project, one data source had several years’ worth of highly granular data, but only 1 year was available to the end user for filtering. By removing these older records, the data source went from hundreds to tens of millions, a 90% reduction in records.
Another data source had information about all products but was only connected to a dashboard for a certain subset of products. Adding a simple data source filter on product type reduced the number of records by 92%.
Optimizing the Data Model
Tableau has many ways to connect to data, but some will perform better depending on the scenario. For this project, our Tableau experts proved to the client through performance testing that one data model was superior to another, such as an extracted connection over a live one or a relationship over a physical join.
What-if Scenarios
Some dashboards don’t have any major flaws or signs that something is wrong–best practices were applied across the data model and the workbook itself. Often, if a dashboard is still performing poorly, it is due to a scope issue, meaning stakeholders are attempting to put too much into a single dashboard.
For this project, there was one such dashboard where the data used was such a fine grain that the data source was in the billions. To help with this scope issue, we created what-if scenarios to show the record count if certain actions were taken, such as grouping a dimension into 3 groups instead of 5 or narrowing the scope to 6 months instead of twelve. In a quick project where we did not have much time with business stakeholders, this was an extremely useful blueprint for them to follow as they assess priorities for the dashboard going forward.

Why phData?
The customer chose to work with phData analytics over other vendors because they had already had great success with our data engineering and machine learning teams. We showed them that regardless of technology or exact data space, we have the capability to solve their complex problems.
Results
By the end of the engagement, the customer had 12 workbooks fully migrated to Databricks and 4 workbooks that either had performance improvements applied during the engagement or had recommendations to help their data engineering teams make improvements in the future. For these 4 key workbooks, the customer received highly detailed documentation outlining what was done, what was still needed, and a helpful analysis of how we got to our recommendations.
The restaurant chain now has faster and better-designed dashboards and documentation to refer to for future workbooks they want to improve.
Reference Diagram
Tableau Performance Improvement Strategy
Take the next step
with phData.
Learn how phData can help solve your most challenging data analytics and machine learning problems.


