Tableau dashboards are often meant to be interactive and allow the user to explore and discover insights. But what if you received a last-minute request from your manager to pull together a presentation to report those insights for an audience that does not have time to explore the dashboard? It can be hard to present the dashboard as a whole since there can be a lot to look at and unpack for an audience.
Instead of exporting the charts as images to throw into PowerPoint slides, you can set up Tableau dashboards as slides instead and export them as a PowerPoint file or present the slides in Tableau itself.

Upload a Slide Template as Background Images
If your company has a slide template that you often use for reporting, you can upload that template as a photo background onto the dashboard. Ensure that your dashboard dimensions are the same as your slide template so that the image fits correctly.
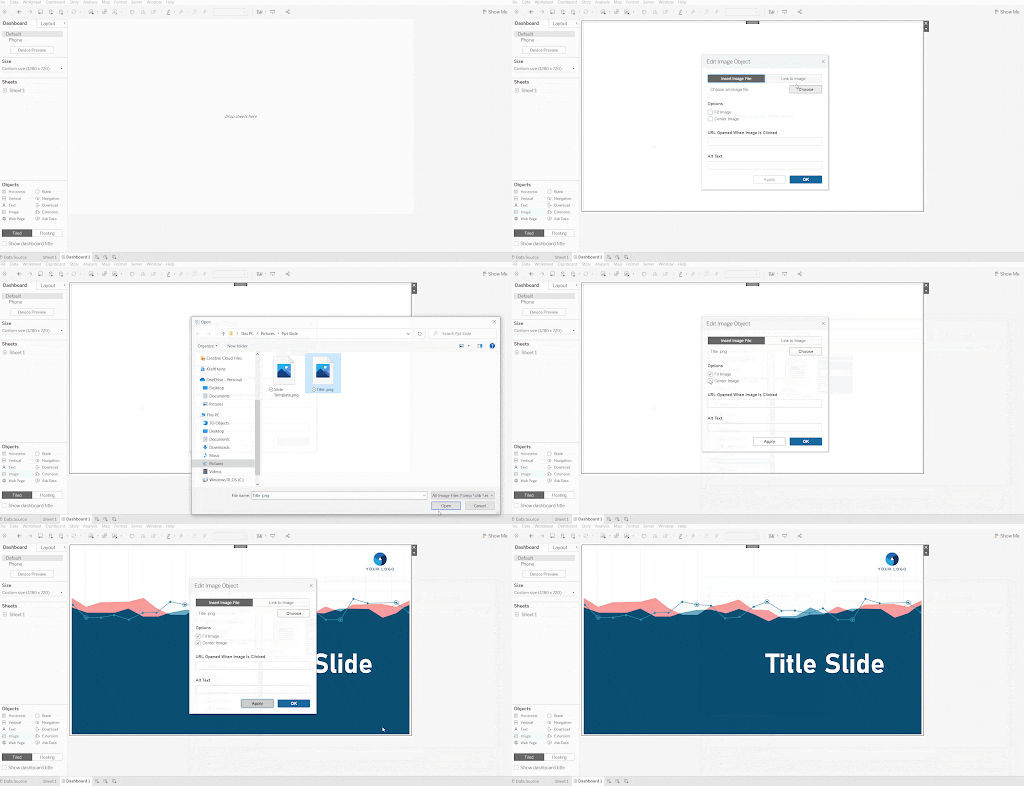
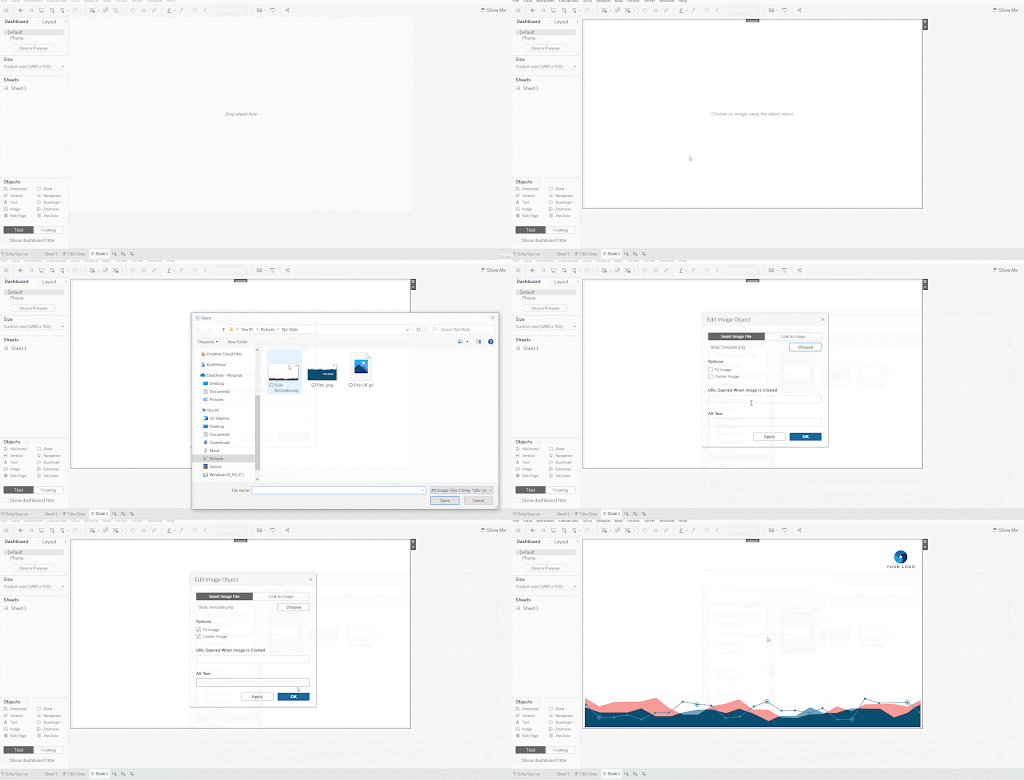
Instead of adding in the photo for each new dashboard tab, simply duplicate the dashboard so you have it ready to go.


Pull Out Specific Visualizations from the Main Dashboard to Focus on
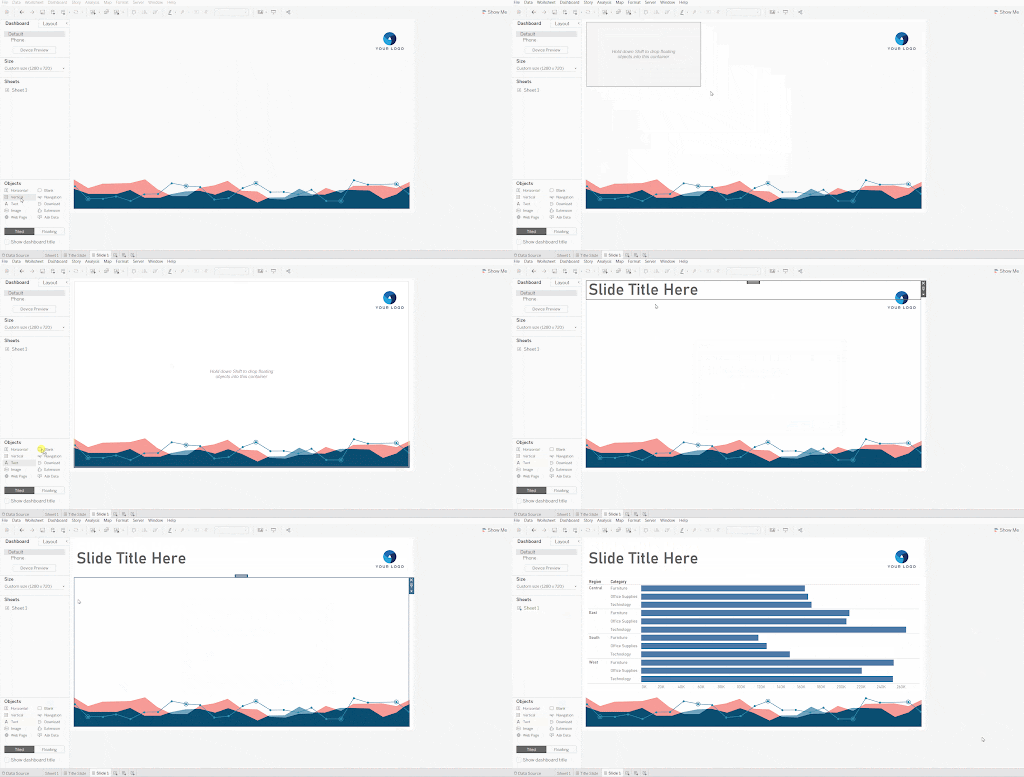
Enlarging a specific chart on a slide will make it easier to read and present to your audience. Make sure that you use a floating container on top of the background, where all your elements will be placed in.
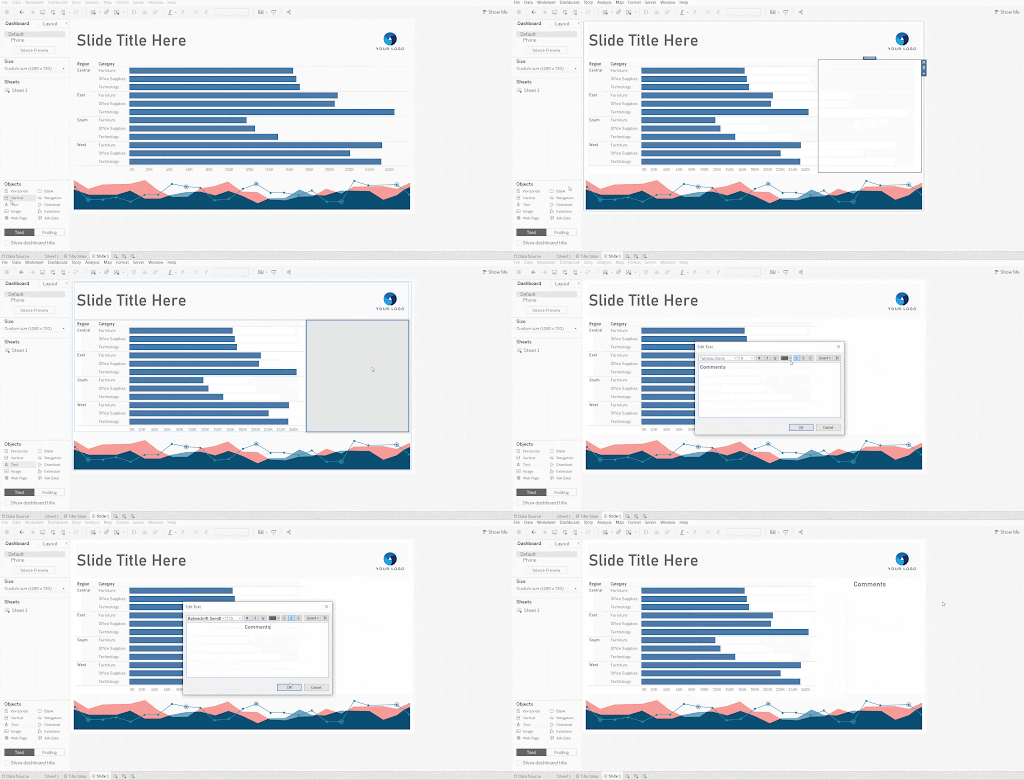
You can leave some room for comments and notes if desired.

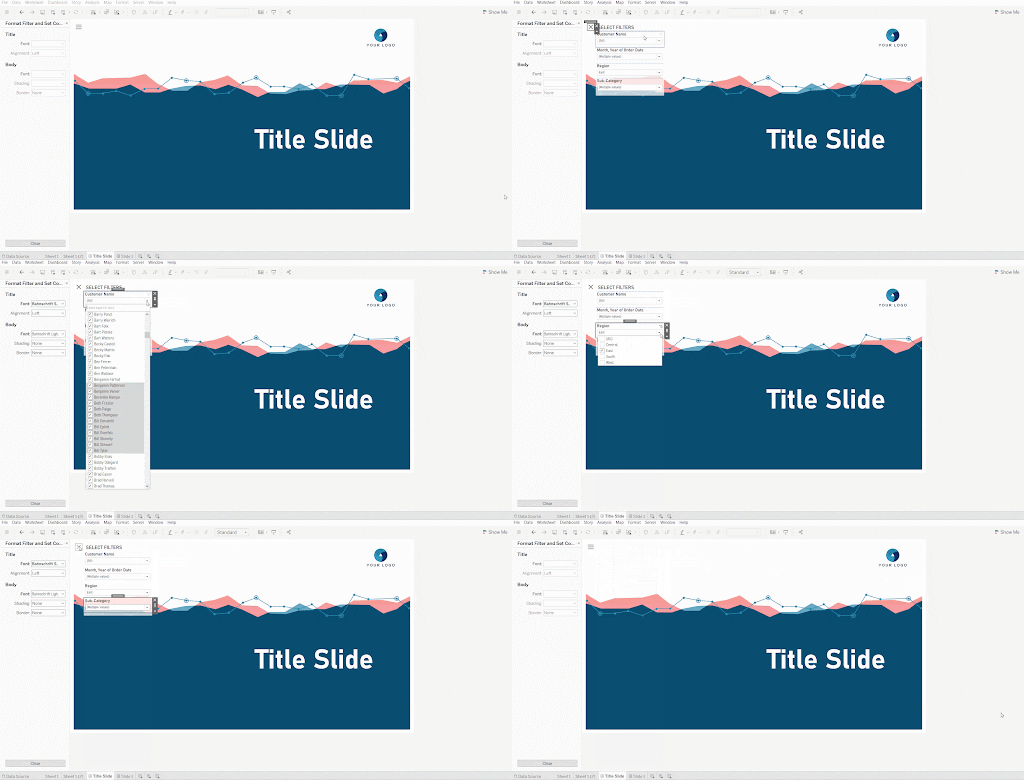
Use Menu Filters on the Title Slide
Add a hidden or collapsible menu filter where you can pre-select the requirements for the report. This will automatically update all the data in the other dashboards that reflect your filter selections.
Why Set up Tableau as Slides?
If you often need to report the same data and information but for different audiences, setting up Tableau dashboards as slides may help. For example, if you are reporting about sales for different countries, you might have to create separate reports for all those countries. Or, for some audiences, maybe including all the categories is unnecessary, or they may be interested in looking at the report from a different time period instead. You can update your filters in Tableau to reflect these requirements and save time from having to re-create many separate charts and reports in excel and PowerPoint combined. Leverage the power of automating your data in Tableau!


