Tables are one of the most powerful and versatile elements in Sigma Computing, serving as the foundation for data exploration, transformation, and storytelling. Whether you’re building a simple dashboard or a complex data model, mastering table elements is key to unlocking the full potential of Sigma’s spreadsheet-like interface.
In this blog, we’ll discuss the fundamentals of using table elements in Sigma Computing. We’ll explore why they matter, how they work, and how you can use them effectively to structure your data workflows.
Whether you’re just starting or looking to sharpen your skills, we’ll also share some essential tips and best practices to help you create clean, interactive, and powerful Sigma tables.
What Are Table Elements in Sigma?
In Sigma Computing, a table is a fundamental data structure that displays data in rows and columns, similar to a spreadsheet. It allows users to explore, analyze, and visualize data from various sources.
Tables in Sigma are dynamic and interactive, meaning users can sort, filter, group, and pivot data directly within the table interface to gain insights. They are a core component for building dashboards and reports in Sigma Computing.
Fundamentals of Using Table Elements
How to Create a Table in Sigma?
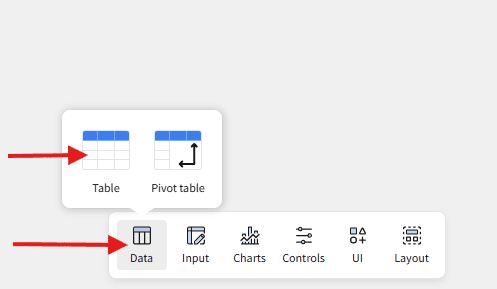
To create a new table, click on Data at the bottom of the screen, then select Table from the options to start building your Table Element.
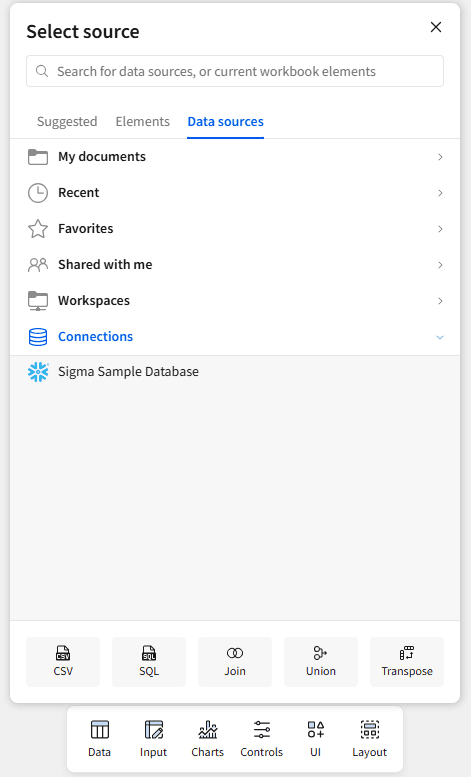
Now, you’ll be prompted to select a data source. Simply select the one you want to use for your table.
What Data Types can be Used in Tables?
Text (String): Used to store names, categories, or any alphanumeric characters.
Numeric (Integer, Float): Handles whole numbers and decimal values for calculations and metrics.
Date & Timestamp: Captures specific dates and times for temporal analysis and filtering.
Boolean: Represents true/false or yes/no logic for binary decisions.
JSON / Variant: Stores semi-structured data for flexible, nested information.
Geography: Enables spatial analysis using points, polygons, and other geospatial shapes.
How to Format Your Table
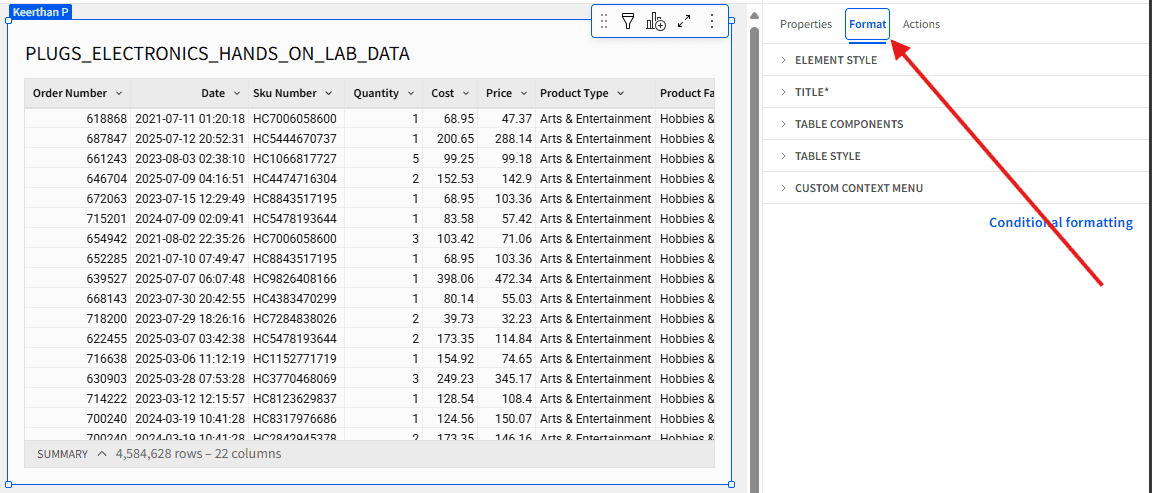
To format your table in Sigma, click on the table, and the Format panel will appear on the right side of the screen. From here, you can customize your table’s appearance and functionality.
Here’s a breakdown of the key formatting sections:
-
Element Style: Adjust padding, borders, background color, and border radius to style the table container.
-
Title: You can show or hide the table title and apply styling options such as font size, alignment, or color.
-
Table Components: Choose to display or hide elements like the summary row, collapsed columns, or even the entire table body.
-
Table Style: Customize gridlines, headers, and cells—control text color, background color, and font settings, and toggle between Spreadsheet View and Presentation View for a tailored visual layout.
-
Custom Context Menu: Create a personalized right-click menu that appears when users interact with table values. The Actions tab allows you to define actions for this menu.
How to do conditional formatting in Sigma?
Conditional Formatting in Sigma allows you to highlight key values, patterns, or exceptions in your data. You can apply formatting rules to dimensions and measures to make your tables easier to interpret.
To apply conditional formatting:
Step 1: Select your table and open the Format panel on the right.
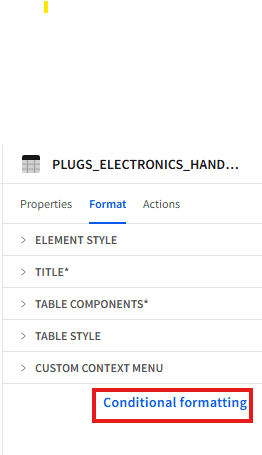
Step 2: Under Conditional Formatting, click + Add Rule.
Step 3: In the Format Rule window, configure the following:
Apply to: Select the column(s) you want the rule applied to.
Format type:
Single Color: Best for dimensions (e.g., categories, status values).
Data Bars / Color Scale: Best for measures or continuous data (e.g., revenue, percentages).
Formatting rule: Choose or create a condition (e.g., Is not null, Greater than, Not like, etc.). You can also write a custom formula.
Apply (Style): Select how the values should appear—text color, background color, bold/italic, or number formatting.
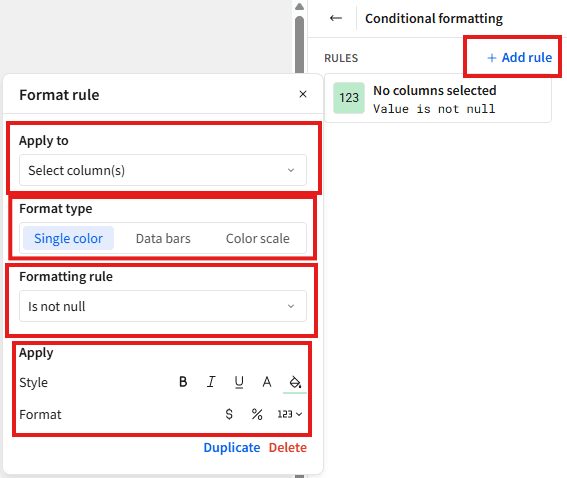
Once applied, Sigma will automatically style your table based on the rules you set, making it easy to spot KPIs, outliers, and trends at a glance.
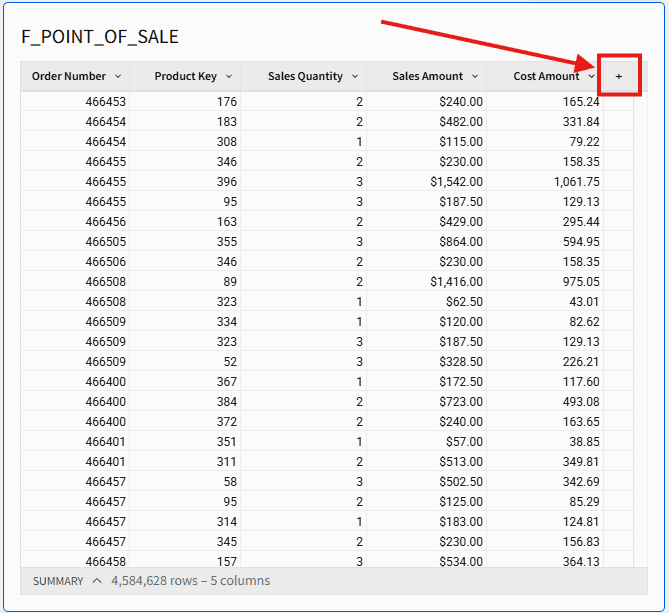
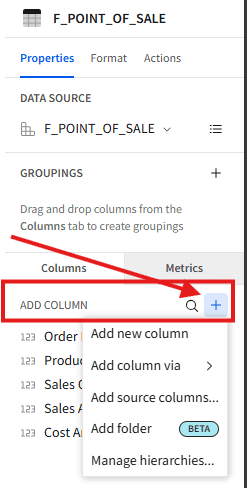
How to add Columns
There are a few options to add a new column to a table:
Option 1: The easiest way to add a new column is to click the + icon at the far right end of your table. This instantly inserts a new column, making it quick and intuitive to expand your data.
Option 2: You can also right-click on any column and choose Add New Column to insert a new column directly next to the selected one perfect for quick calculations or custom logic.
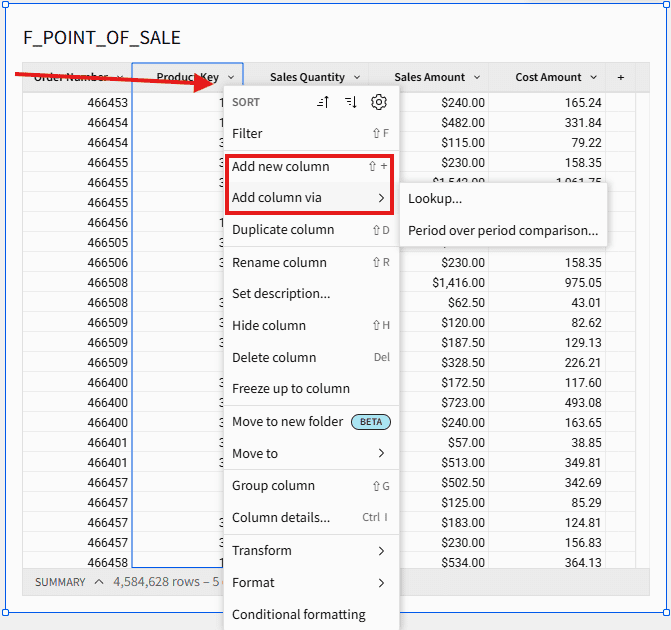
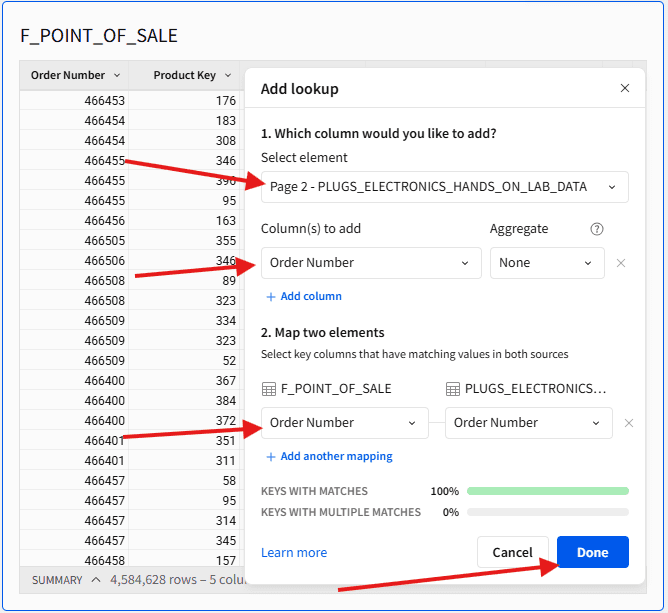
Option 3: You can add a Lookup column by right-clicking on an existing column and selecting Add Column Via > Lookup. This will open the Add Lookup pop-up, where you can choose the source table and the column you want to bring in. Once selected, click the Done button at the bottom to complete the lookup.
Option 4: You can also click the ( + ) icon in the right-hand Columns panel to open a menu with multiple options. From here, you can:
Add a new custom column
Add column via lookup column/Period-over-Period
Add a column from the source table
This gives you full flexibility to enrich your Table Element directly from the sidebar.
Column Details
Column Details in Sigma provide a quick snapshot of your data’s structure and quality, helping you explore key stats, top values, and summaries in one click.
To access it, click on a column and select Column Details.
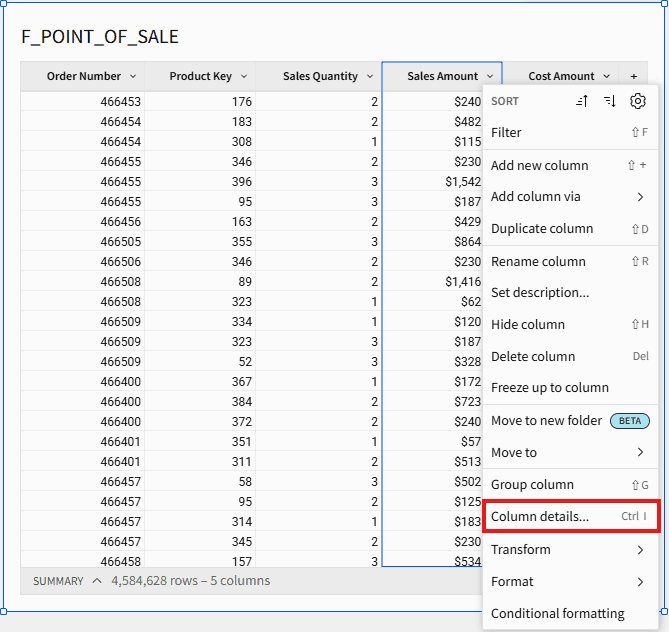
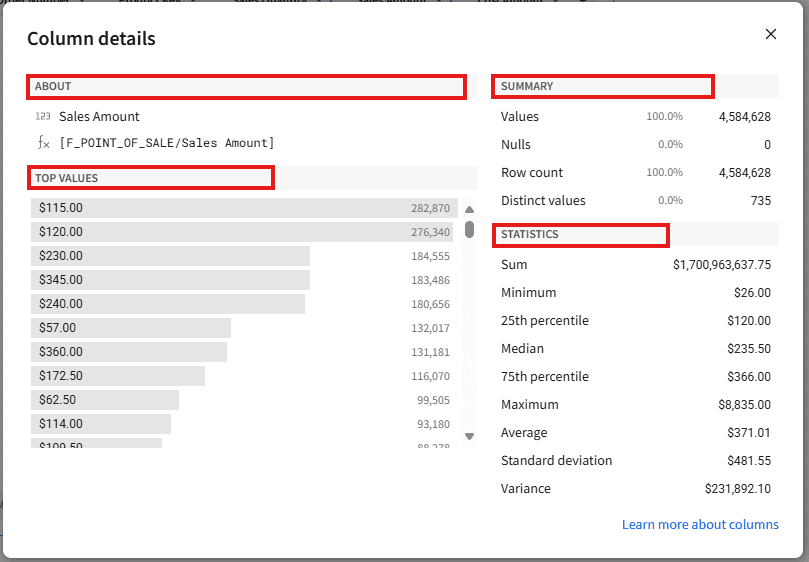
When you click on a column’s dropdown and choose Column Details, a pop-up window provides a quick snapshot of the key information about that column. It includes four main sections:
About: Displays the column name and data type, helping you quickly identify the structure.
Summary: This gives a high-level overview, including the total row count, number of nulls, and number of distinct values.
Top Values: Lists the most frequently occurring values in the column and their frequency—great for spotting dominant categories.
Statistics: This tool shows detailed numeric insights, such as minimum, maximum, average, median, and percentiles (for numeric fields).
Behavior by Data Type:
✅ Numeric: Full statistics (min, max, average, median, percentiles, sum) + top values.
✅ Text & Date: Only the Minimum and Maximum are shown in the Statistics section.
✅ Boolean: Only About and Summary sections are available, no top values or stats.
❌ JSON / Geography: The Column Details option is unavailable for these types.
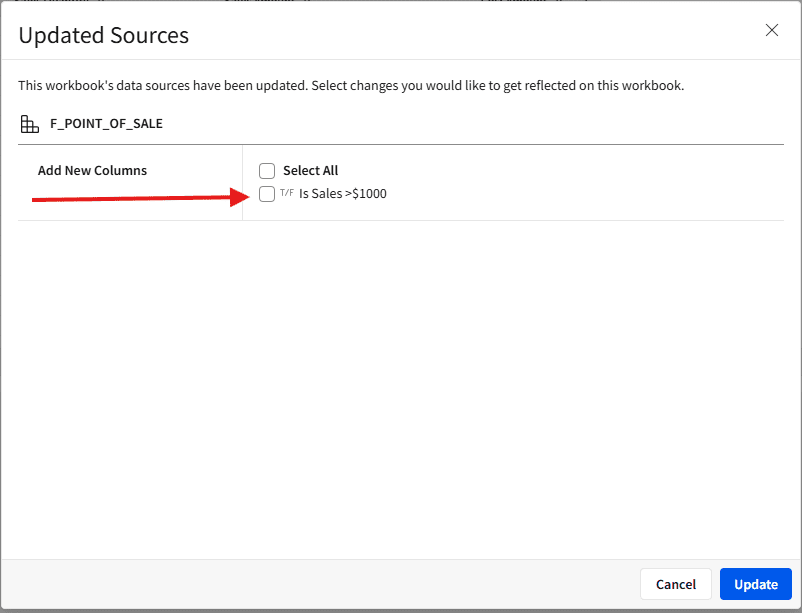
How do I add a new column to a table when a new column is added to my source table?
When a new column is added to the source, it won’t automatically appear in the existing table.
To add it manually, switch to Edit Mode in the workbook. Sigma will display a pop-up highlighting the newly available columns. Select the columns you want to add, then click Update to include them in your table.
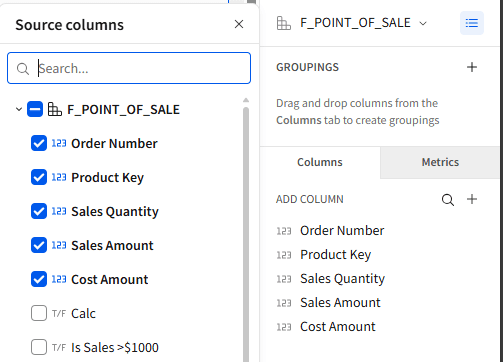
You can also add newly added columns to an existing table by clicking the ( + ) icon in the right-hand panel and selecting Add Source Column. This allows you to bring in any new fields recently added to the underlying data source.
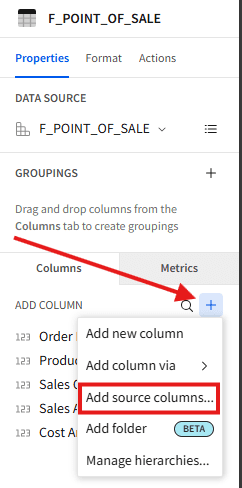
Now you will get this screen to choose the column you want to add.
How to Create a Formula
To create a new formula, click Add Column and enter your logic in the formula editor. You can either type or click on column names to insert them. Sigma also provides Formula Assistance, which suggests functions and available fields and explains the formula you’re writing or viewing. This makes it easier to understand existing logic and build accurate formulas, even if you’re new to Sigma or unfamiliar with the function syntax.
What is a grouping table in Sigma?
A grouping table organizes rows based on the values in one or more columns. Grouping allows you to summarize data, for example, grouping sales by region or product category to view totals or averages quickly.
To know more about grouping tables,you can refer to Table Groupings & Table Summary in Sigma Computing.
Best Practices
-
Use Clear, Descriptive Column Names
Ensure your column names are easy to understand and meaningful for end users. -
Select Only the Required Columns from the Source
Bring in only the columns to keep your table clean and efficient. -
Hide Table Summary When Not Needed
You can hide the summary row for a cleaner layout if presenting a simple data view.
Explore More:
In addition to these best practices, you can learn more by checking out Sigma’s official Table Quick Starts. These tutorials provide hands-on examples and step-by-step guidance for working with tables in Sigma.
Closing
Now that you understand the fundamentals of working with Table Elements in Sigma Computing, you can start building cleaner, more interactive, and more insightful tables for your dashboards. With these skills, you can structure your data effectively, apply consistent formatting, and use Sigma’s advanced features to deliver impactful, decision-ready insights to your audience.
As you put these techniques into practice, you’ll find it easier to maintain consistency across projects and adapt quickly to evolving data needs. The more you explore Sigma’s capabilities, the more opportunities you’ll uncover to turn raw data into meaningful stories.

Have questions?
If you ever want help taking your tables to the next level or have questions as you dig deeper into Sigma’s features, reach out to the team at phData. We’re always here to brainstorm ideas, help troubleshoot, or just talk through your data challenges, so you get the most out of every project!
FAQs
How do you join two tables in Sigma?
You can join two tables in a Workbook or Data Model using the Join step. Select the primary table, add a join, choose the secondary table, and define the join keys. Sigma supports different join types like inner, left, right, and full outer joins.
To know more about joins in Sigma, you can refer to What is a Data Join in Sigma Computing?
What is the lookup function in Sigma?
The lookup function lets you bring in a column from another table based on a matching key. This is useful for enriching your table with additional information without creating a full join. You can add a lookup column by right-clicking a column > Add Column Via > Lookup.
To know more about lookup and join in sigma, you can refer to Lookups, Joins, and Unions in Sigma Computing: A How-To Guide and Data Modeling in Sigma Computing: What is the Difference Between Lookups vs. Joins?