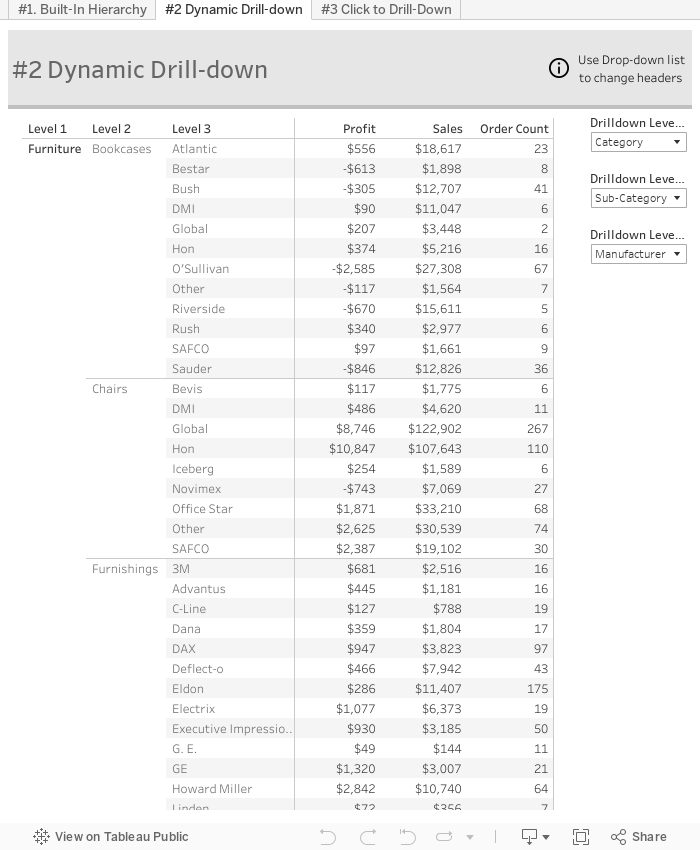
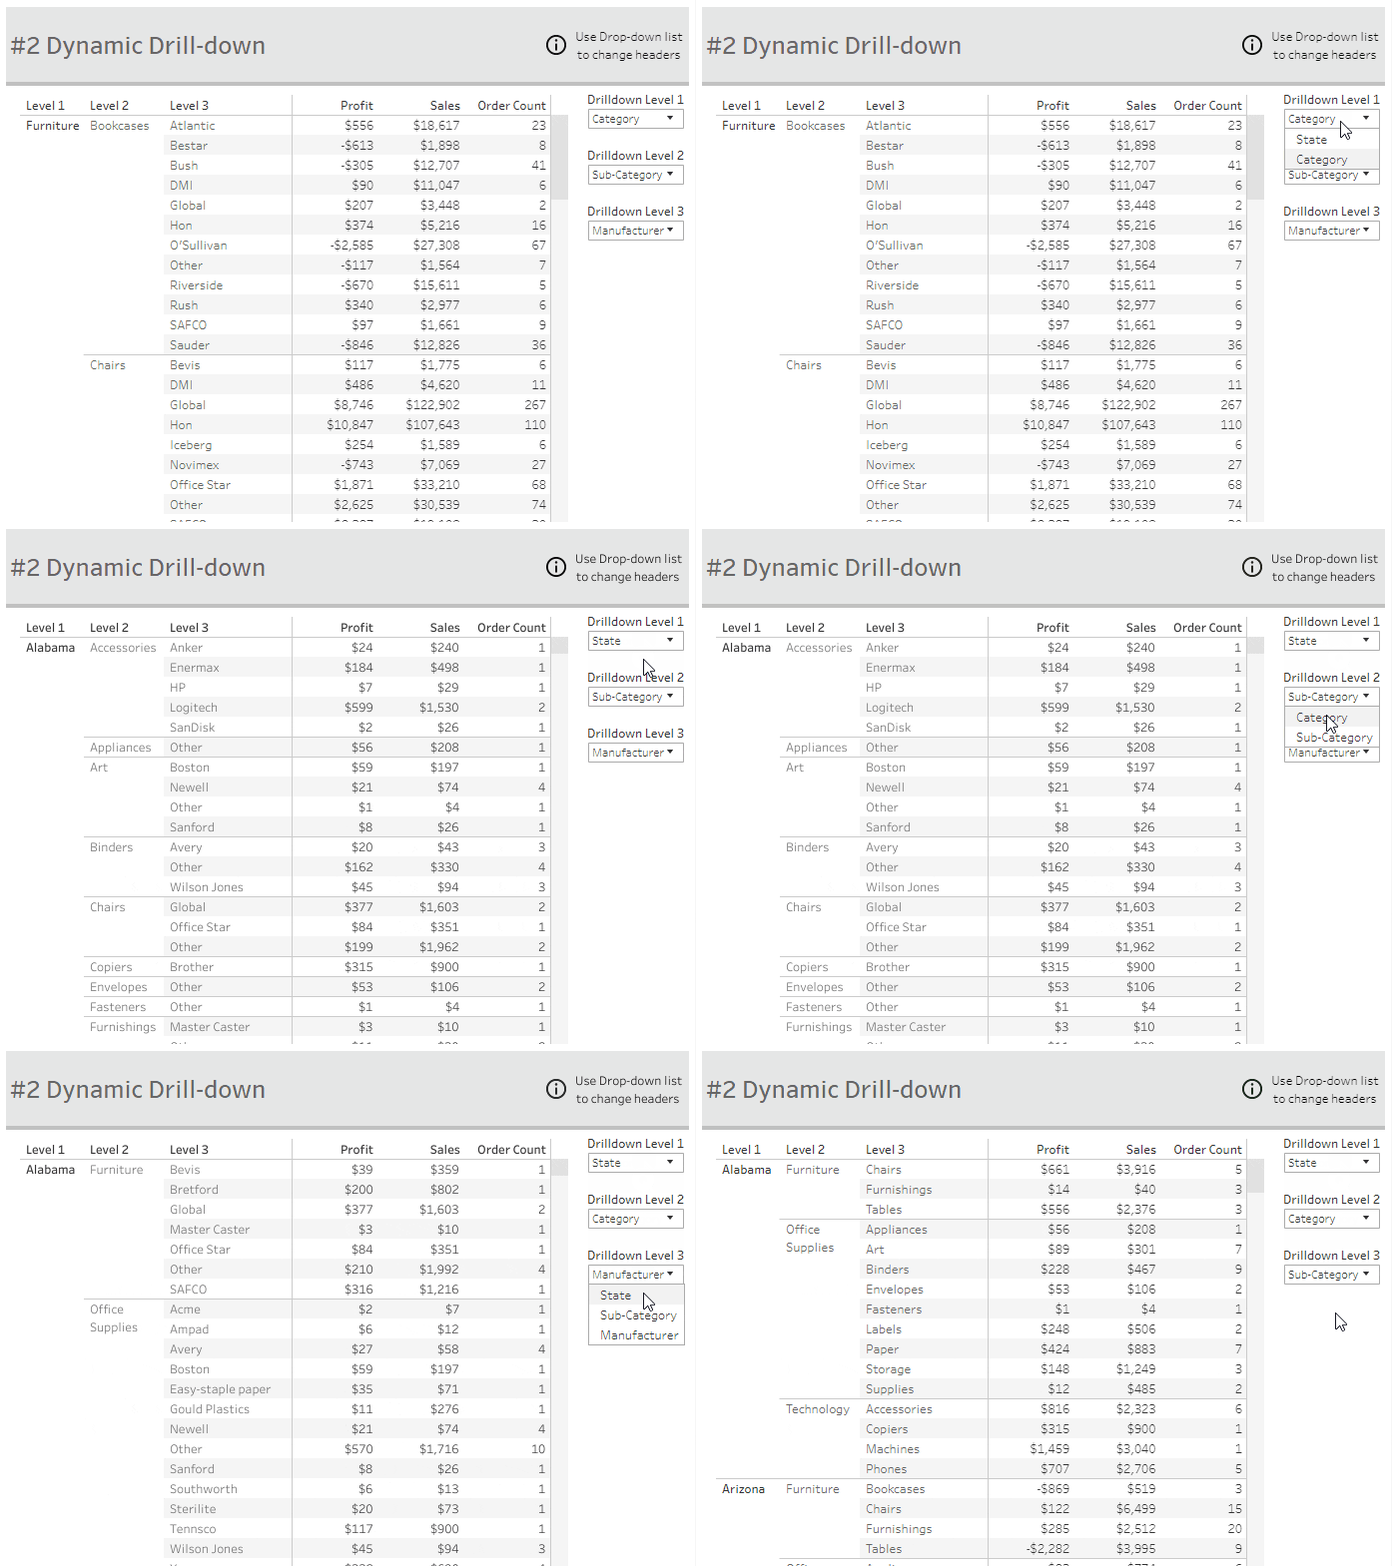
This option is great for situations where the drill-down path might not always be the same.
For this example, we are going to create two drill-down paths :
Category > Sub-Category > Product Name
State > Category > Manufacturer
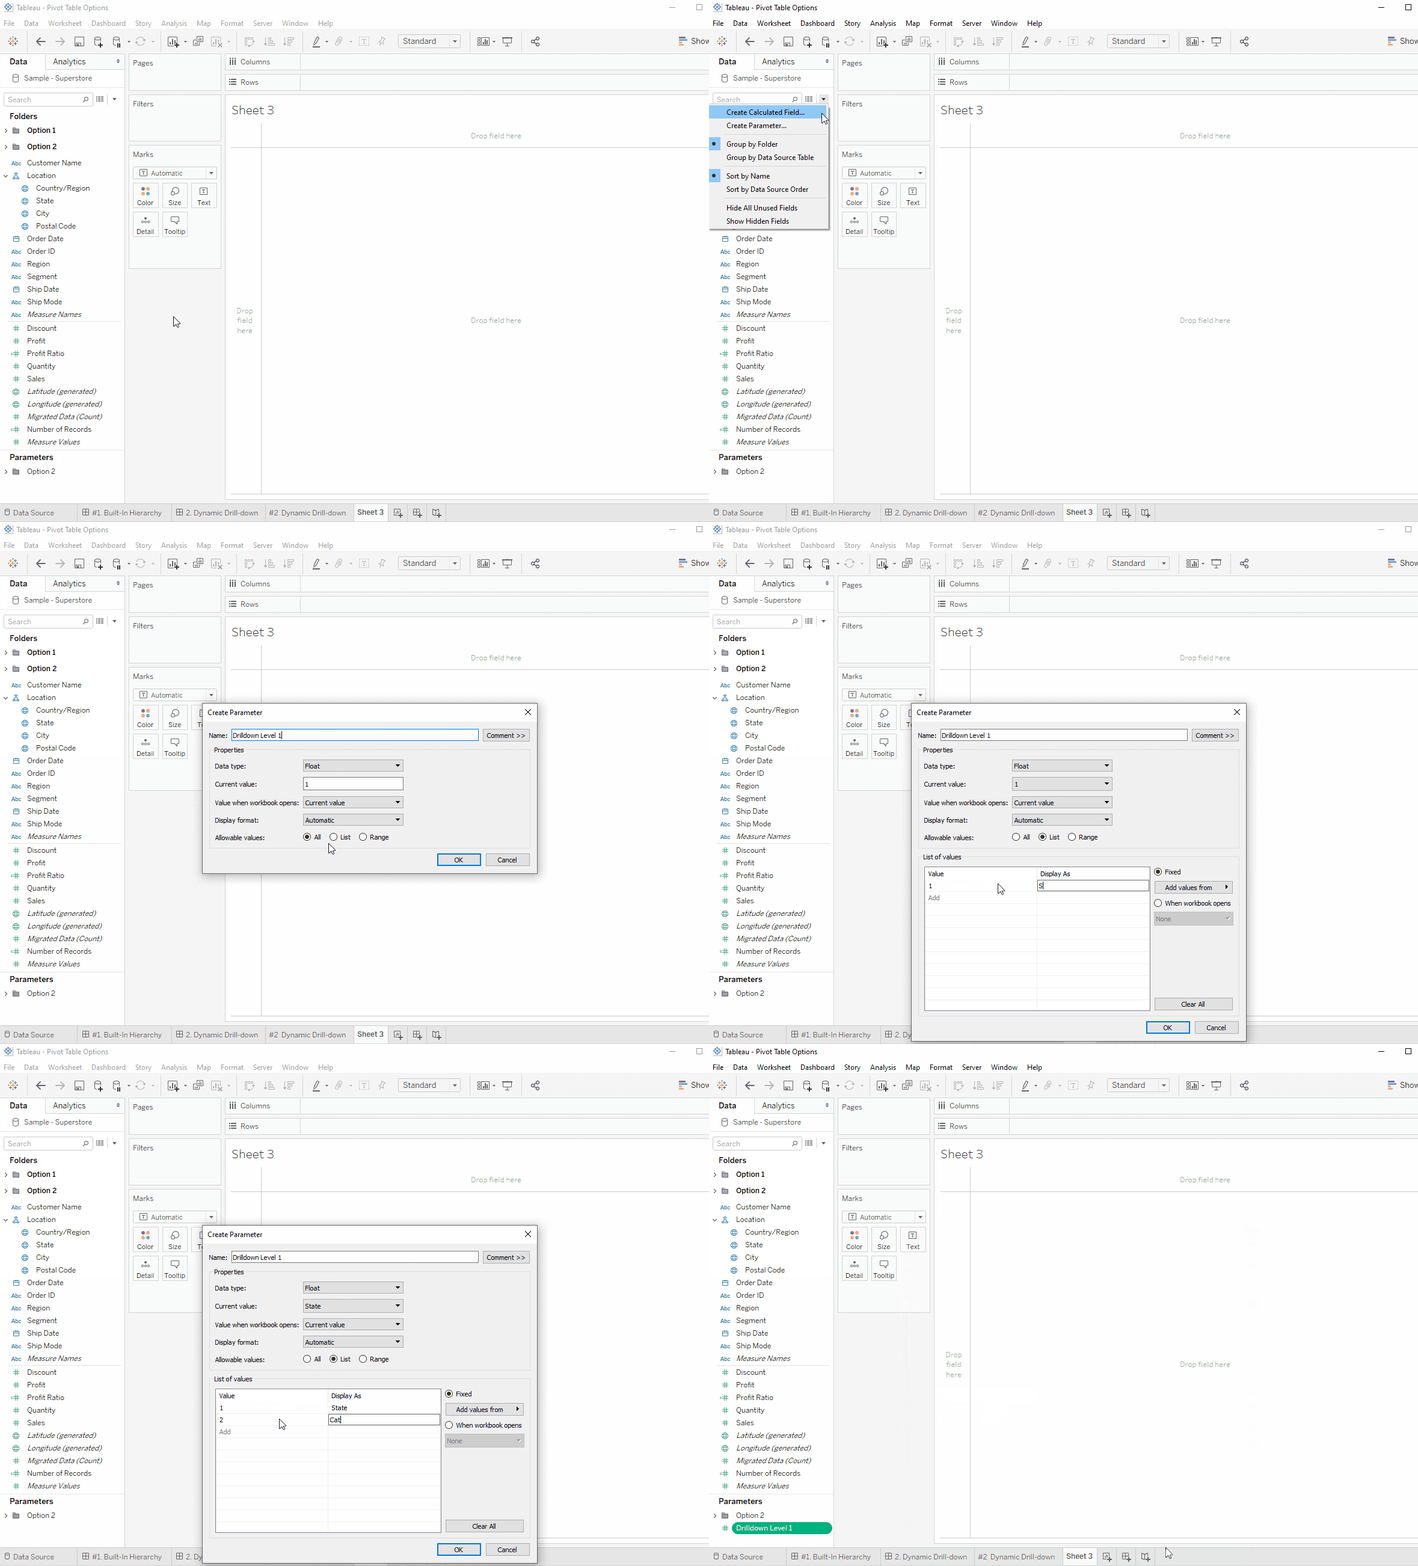
Step #1: Create Level Parameters
Create a Parameter that lists the options for Level 1.
Repeat for each drill-down level.
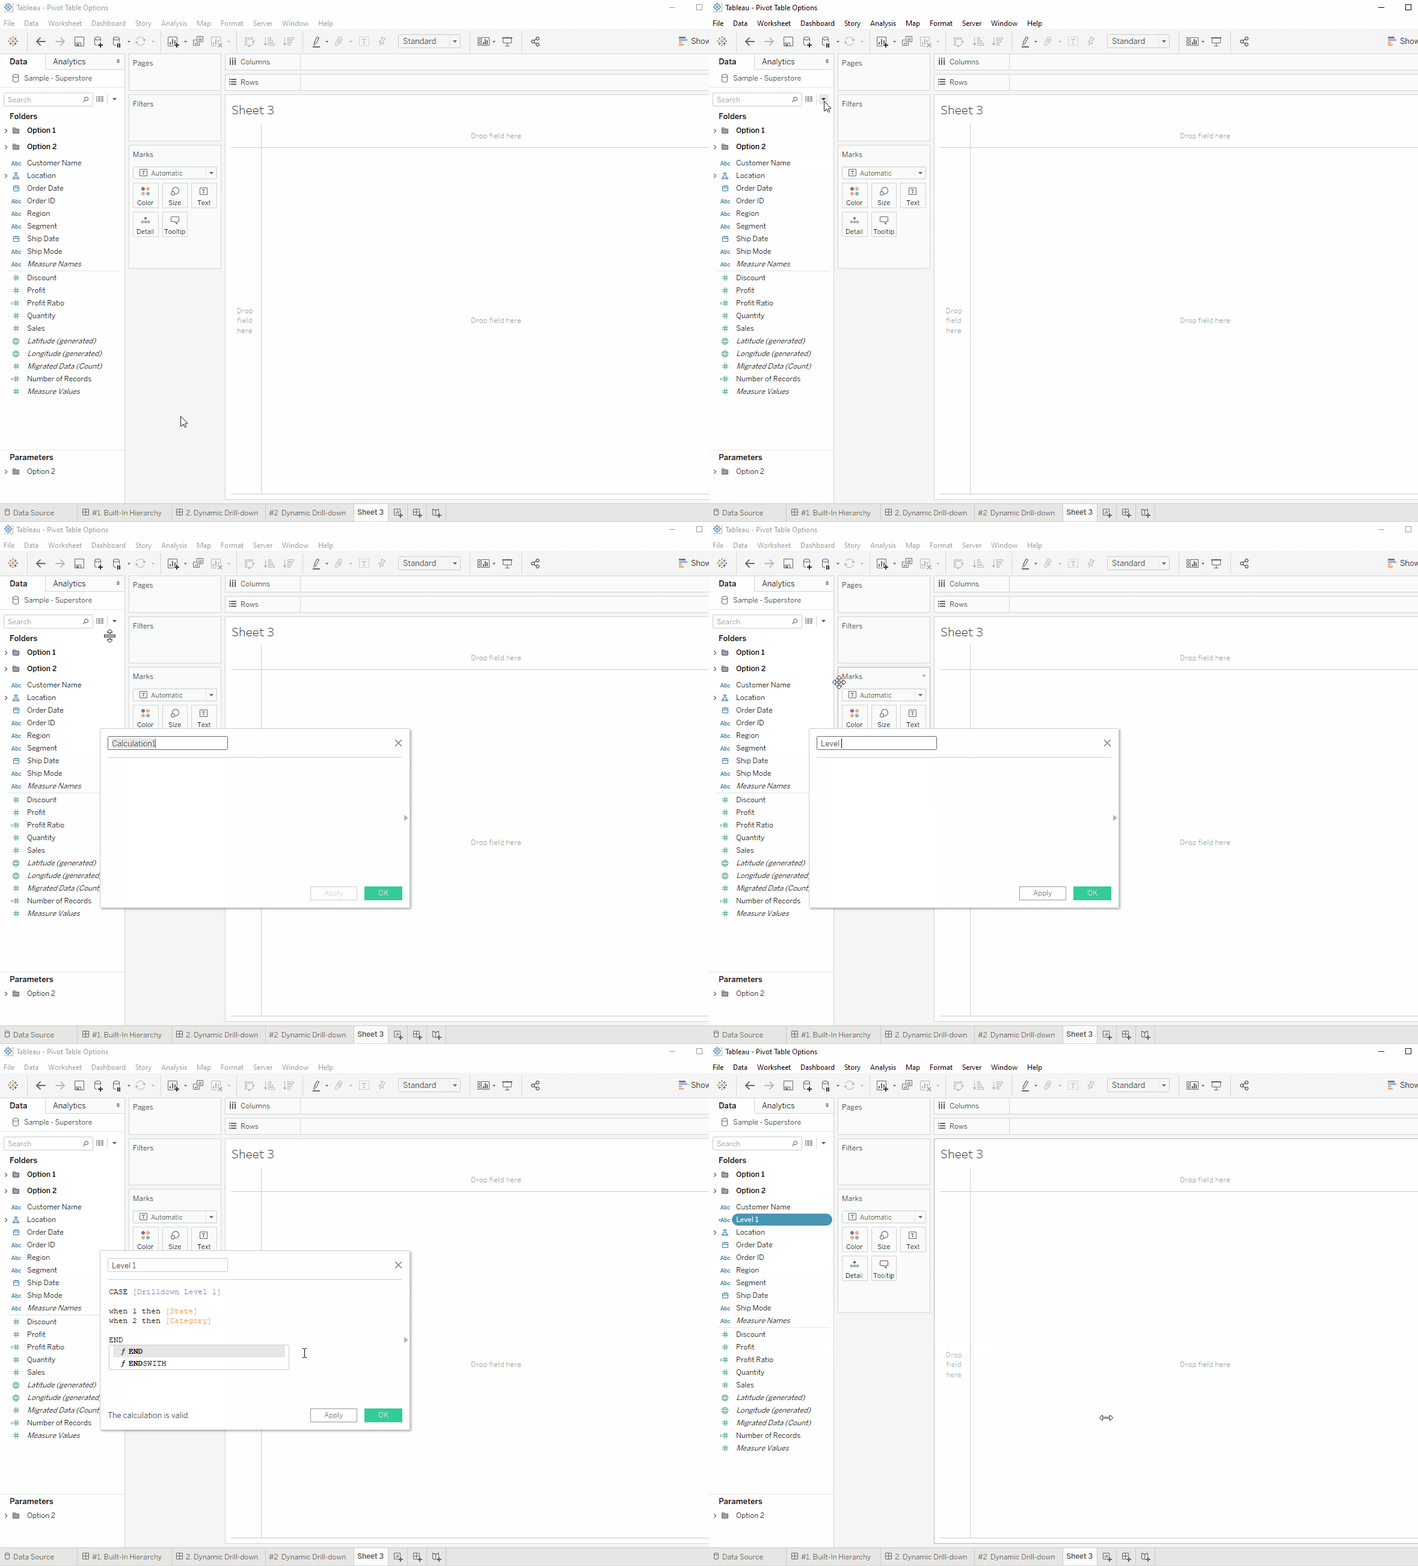
Step #2: Create Display Formulas
Create a calculated field that identifies the field that should be displayed based on each level’s parameter selection.
Repeat for all levels.
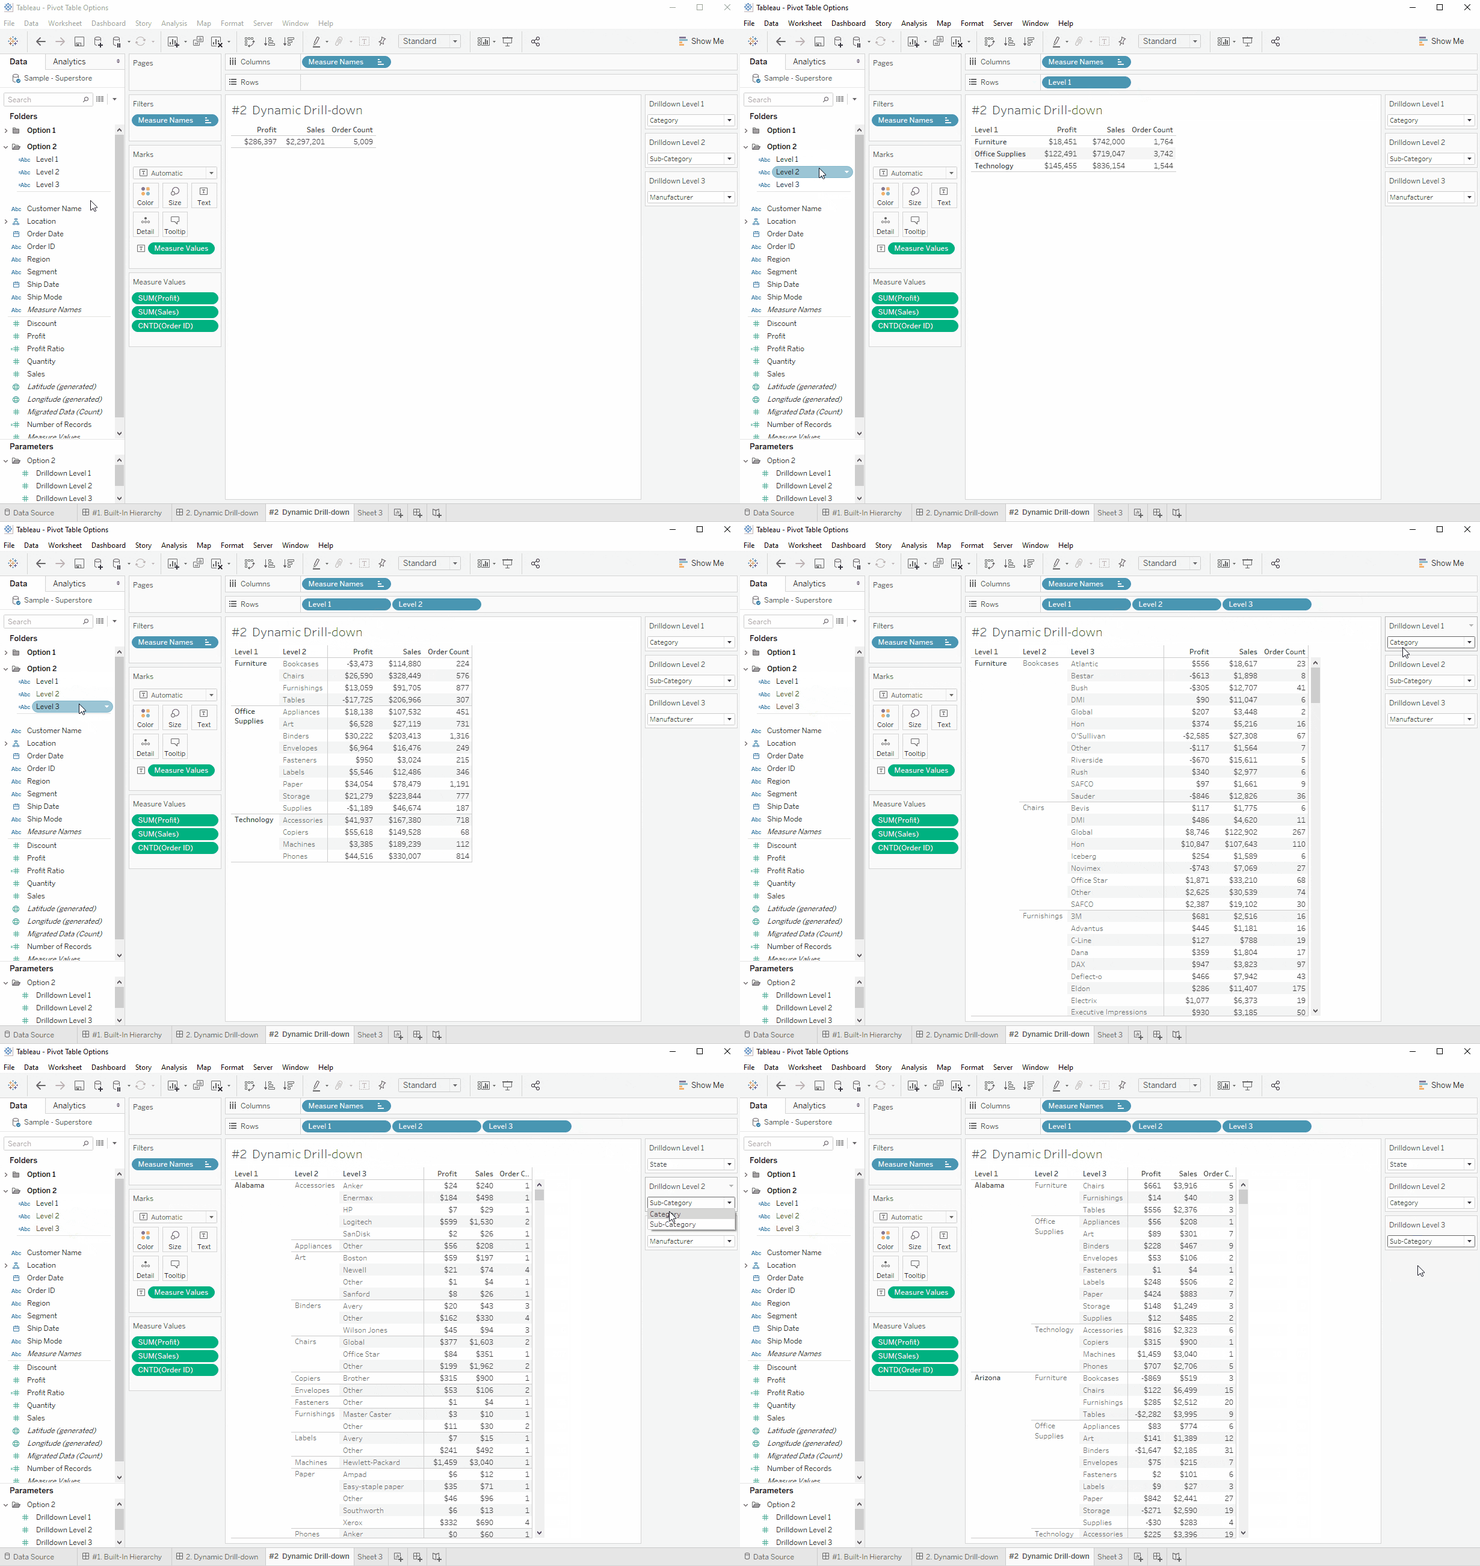
Step #3: Create Viz
The last step is to add the Level calculations to the sheet.
Step #4: Formatting and Final Touches
Once your sheet is on a dashboard, I suggest adding instructions for the end-user. It is also a good idea to test the sizing of the columns and rows to make sure the data is clearly displayed when the levels change.
More to explore
phData Updates
phData and Snowflake Expand Strategic Collaboration to Help Enterprises Put AI Into Production