
Teams tracking AI token consumption are measuring cost, not engineering productivity.
Engineering productivity breaks down into four measurable categories: speed, developer effectiveness, software quality, and business impact.
AI acts as a multiplier, speeding up strong engineering practices and weak ones at the same rate.
Real productivity measurement combines quantitative data from Git and Jira with qualitative signals like developer experience.
Most teams adopting AI tools track token consumption and call it a measurement strategy. It isn’t. Tokens are a cost proxy, not a productivity signal. If you want to know whether AI is making your engineering team more productive, you need to measure engineering productivity first, and that’s the harder problem.
What is AI consumption?
AI consumption is about cost. Tokens are a relatively intuitive unit of scale, but they’re just a proxy for spend. Consumption is a single-faceted metric. Without other measurements alongside it, AI consumption tells the business nothing about value.
What does productivity actually mean for engineering teams?
Development productivity can be defined in multiple ways, but it typically spans cost, revenue, performance, efficiency, effectiveness, and quality. Effectiveness and quality are the hardest to measure and carry the largest impact on long-term total cost and revenue.
Effectiveness is the ability to reach a desired output. Software that doesn’t produce its intended output is worthless from a business perspective unless it can be repurposed.
Quality is harder to define. For practical purposes: the degree to which software is efficient and effective with the simplest code possible that can be modified without introducing significant regressions. High-quality software is faster, more effective, and easier to maintain. That translates directly to cost. More importantly, it lets the engineering team move when business needs change. Time to value matters.
Quality means different things depending on context. For a product with an established user base, high productivity means stable, consistent user experience, low operating cost, reliable output, and a codebase engineers want to work in. For a startup racing to market, high productivity might mean fast releases, quick feedback loops, and acceptable quality for non-critical features.
Development productivity can be defined in multiple ways, but it typically spans cost, revenue, performance, efficiency, effectiveness, and quality.
How do you measure engineering productivity?
Measuring engineering productivity is hard for three reasons. First, you have to define what productivity means for your team and your business.
Second, you have to figure out how to actually measure those elements. That can range from relatively easy to extremely difficult.
Third, metric history and consistency matter. The way you define productivity now will almost certainly be incompatible with how you define it later, and you probably will redefine it.
Quantitative vs qualitative
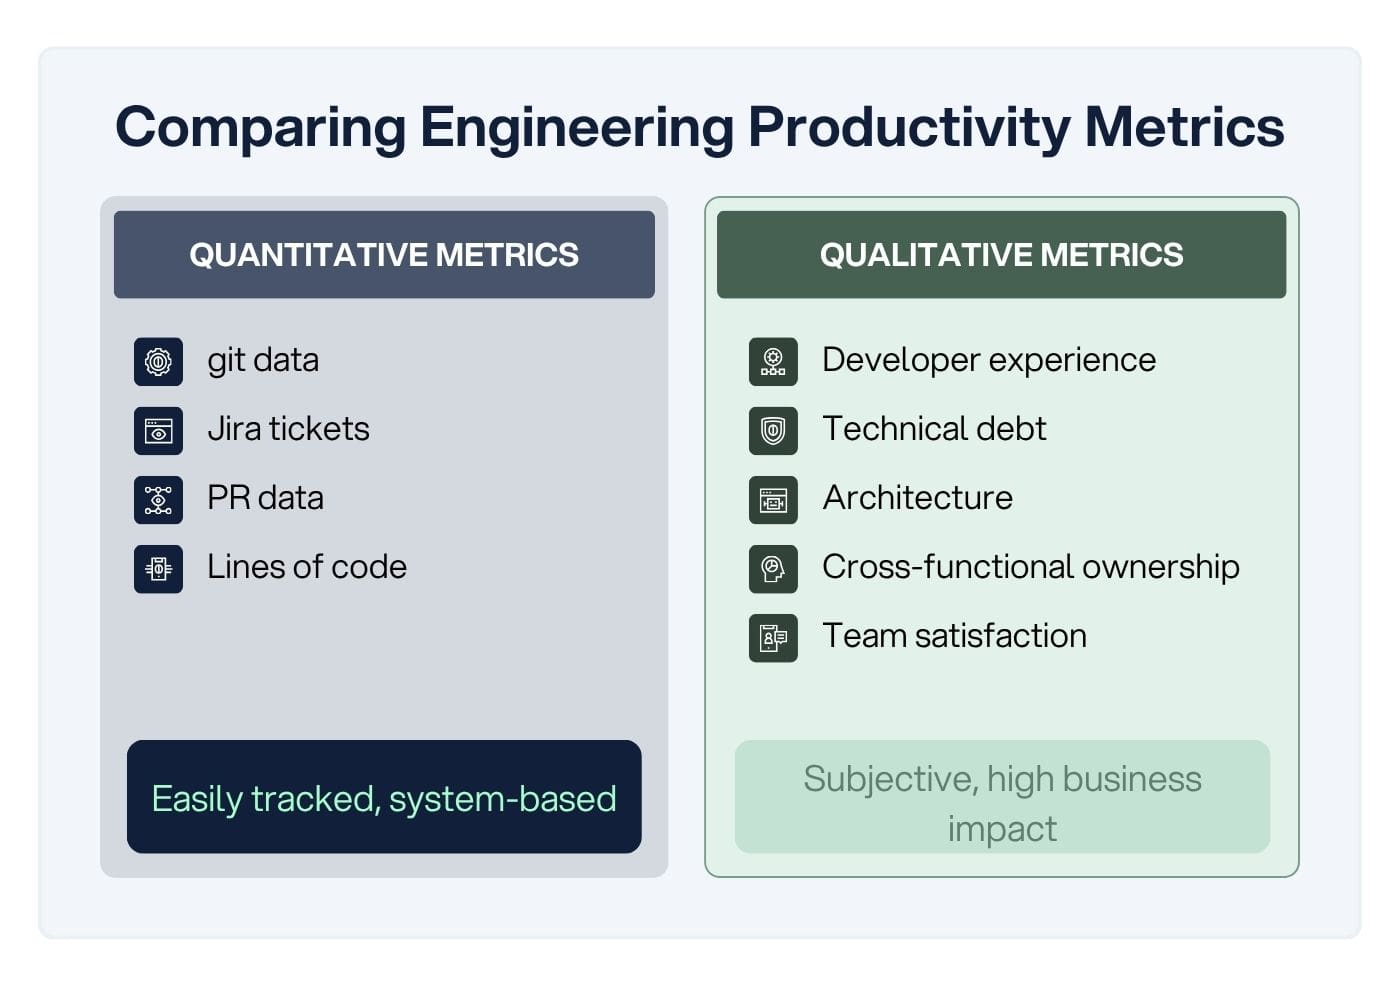
Quantitative metrics come from systems like Git, Jira, and Pull Request (PR) data. They’re the easiest to collect. Tempting as it is to rely primarily on them, they’re not sufficient.
Lines of code is a clear example. Suppose an engineer has averaged five lines of code changed per month for three months. That engineer could still be the most productive on the team:
They’re doing deep optimization work on a high-traffic shared library, code that requires specialized expertise and flawless execution. Those few lines could save millions of dollars over the next year.
They’re tracing difficult bugs that require complex recreation steps and consume most of their time.
They own code review, architecture, prioritization, and stakeholder communication. They have a cross-functional understanding few others do.
Qualitative metrics are more subjective but equally important. Is the team unhappy working in the codebase because of accumulated technical debt? You’ll lose top engineers, which drags down everyone’s productivity. Are team processes slowing contributions? Are developers struggling to find relevant information? These signals matter. They just don’t appear in a dashboard.
Metric categories
These categories draw from 16 developer productivity metrics top companies actually use.
Speed
Speed metrics measure how quickly code moves from development to production:
Deployment frequency — more frequent is generally better. (quantitative)
PRs per engineer — directional indicator; don’t over-index on it. (quantitative)
Lead time for a code change to reach production — faster is better as long as quality holds. (quantitative)
Perceived rate of delivery — important for developer satisfaction. (qualitative)
Developer effectiveness
Effectiveness metrics measure how easy it is for developers to complete tasks efficiently:
Time to 10th PR — measures onboarding effectiveness. (quantitative)
Developer experience — how much developers enjoy the project and how easily they can ramp up on new concepts. (qualitative)
Regrettable attrition — losing high performers is expensive and demoralizing. (mostly quantitative)
Software quality
Quality metrics measure reliability and stability:
Perceived software quality — captured through surveys, in-app feedback, etc. (qualitative)
Operational health and security metrics. (quantitative)
Change failure rates — frequent failures from changes are a problem. (quantitative)
Impact
Impact metrics connect engineering work to business value:
Revenue per engineer at the org level. (quantitative)
R&D as a percent of revenue at the org level. (quantitative)
Initiative progress and ROI — for example, did adopting a new tool move other metrics positively or negatively? (quantitative)

How does AI impact engineering productivity?
AI is more multiplicative than additive for engineering teams. Good engineers can build high-quality software faster than ever. Engineers who lack good judgment can produce bad code faster than ever. The multiplier applies in both directions.
Code review has always served as a mechanism for building shared understanding of the codebase and catching problems early. Up-front design handles architectural issues; code review catches lower-level design problems — the abstractions in an implementation, the assumptions baked into a data model. Dedicated tools (static analysis, linting, fuzzing, testing) handle most bug-catching. Code review is primarily about shared understanding.
Because engineers can produce code faster than ever, that shared understanding has become harder to maintain and more important to protect. The code is a proxy for the system,for how it’s supposed to work, why it works that way, and how it connects to business goals. AI is bad at this.
According to a 2024 Microsoft study, developers spend 11% and 9% of their work week dedicated to coding and bugfixing, respectively. The rest of the time goes to meetings, design, testing, requirements gathering, and thinking. Even if AI eliminated all code-writing time, a substantial workload remains, and most of it is harder to automate.
But the most important factor in software is taste. Taste isn’t a buzzword. Taste is knowing what to build, why you’re building it, and how it should work. AI is bad at all three of these.
Where to start
- Define what productivity means for your team and your organization.
Collect data from Git, Jira, code reviews, and PRs that supports your productivity definition.
Find the pain points in your team processes and address them. Pain points slow things down and drive away good engineers. Eliminate unnecessary hurdles. Automate repetitive tasks. Automate CI/CD — testing, static analysis, deployment — where applicable.
Emphasize ownership regardless of whether the author is a person or AI. A person must own the output and be responsible for it.
Establish a feedback loop for your software users. Triage and prioritize what they tell you.
Establish a feedback loop for your developers. Triage and prioritize that too.
Iterate quickly. Getting feedback sooner is more valuable than spending time building the wrong thing. That’s the spirit of agile — the specific flavor matters far less than the principle.
Restrict AI consumption based on its impact on your productivity goals. Mandating AI use as a productivity strategy is a red flag.
Engineers who refuse to try AI at all are also a red flag. Great engineers look for better tools.
How phData can help
phData helps data and engineering teams build measurement frameworks that connect AI investment to business outcomes.
FAQs
What’s the difference between AI consumption and AI productivity impact?
AI consumption measures cost — typically in tokens or dollars spent on model inference. AI productivity impact measures whether that spend is actually making your engineering team more effective. The two don’t automatically correlate. You can consume a lot of AI and build lower-quality software faster, which is a net negative. Measuring them independently first, then looking for correlations, gives you a clearer picture of what’s actually happening.
What metrics should I track to measure engineering productivity?
Start with a definition of productivity that fits your context, then build toward four categories: speed (deployment frequency, lead time), developer effectiveness (time to 10th PR, developer experience, attrition), software quality (change failure rates, operational health, perceived quality), and impact (revenue per engineer, initiative ROI). Quantitative metrics from git and Jira are easiest to collect, but qualitative signals — how engineers feel about the codebase, whether they can find what they need — are equally important.
Is AI good or bad for engineering teams?
It depends entirely on the quality of the engineers using it. AI is multiplicative, not additive — it amplifies the decisions your engineers make. Good engineers ship higher-quality software faster. Engineers with weak judgment can now ship bad code faster. The impact on any given team is a function of the team, not the tool.
How do you measure software quality in a meaningful way?
Quality has two measurable components and one that’s harder to capture. Quantitatively: change failure rates, operational health metrics, and security posture. Qualitatively: perceived quality from users (surveys, in-app feedback) and developer experience within the codebase. The harder-to-measure piece is “taste” — whether the software actually does what users need in a way that feels right. That shows up eventually in churn, support volume, and team attrition, but not on a sprint dashboard.


