November 13, 2020

Building an Executive Dashboard in Tableau

By Luke Stanke

Over the course of 2020, I’ve put out more than 25 blog posts. If you had taken the time to read and learn from each blog you would be able to create a one-of-a-kind dashboard.

In this post we’ll give you the links to rebuild our Superstore Sales Dashboard for Executives below:

KPIs

If you want to build these KPIs, check out the following:

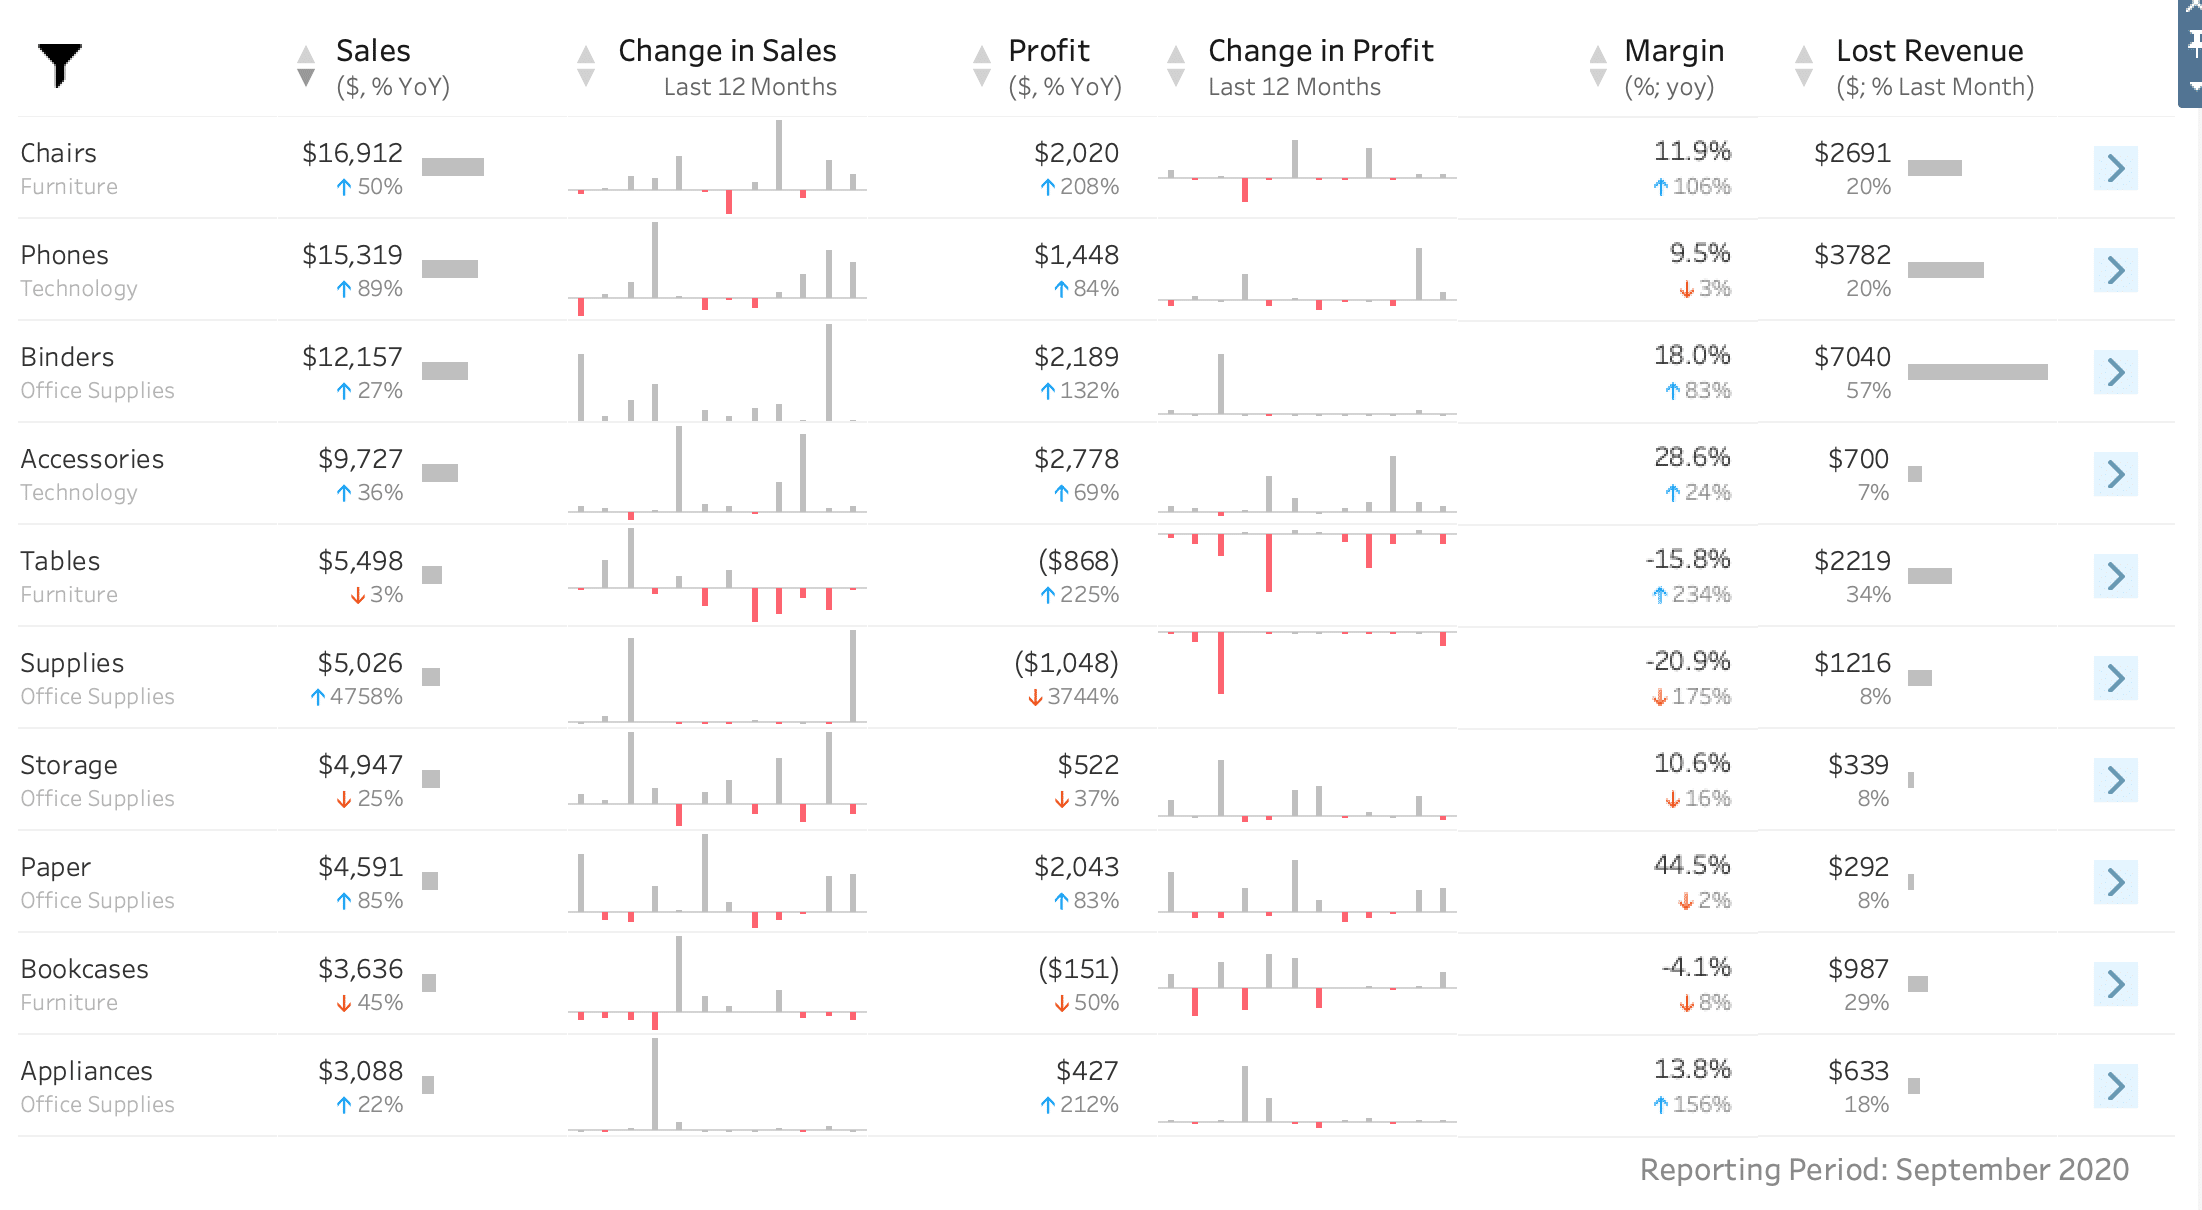
Custom "Tables"

Our end-users love tables. But sometimes creating what they really want takes building something outside-the-box. Learn about building the components in the table:
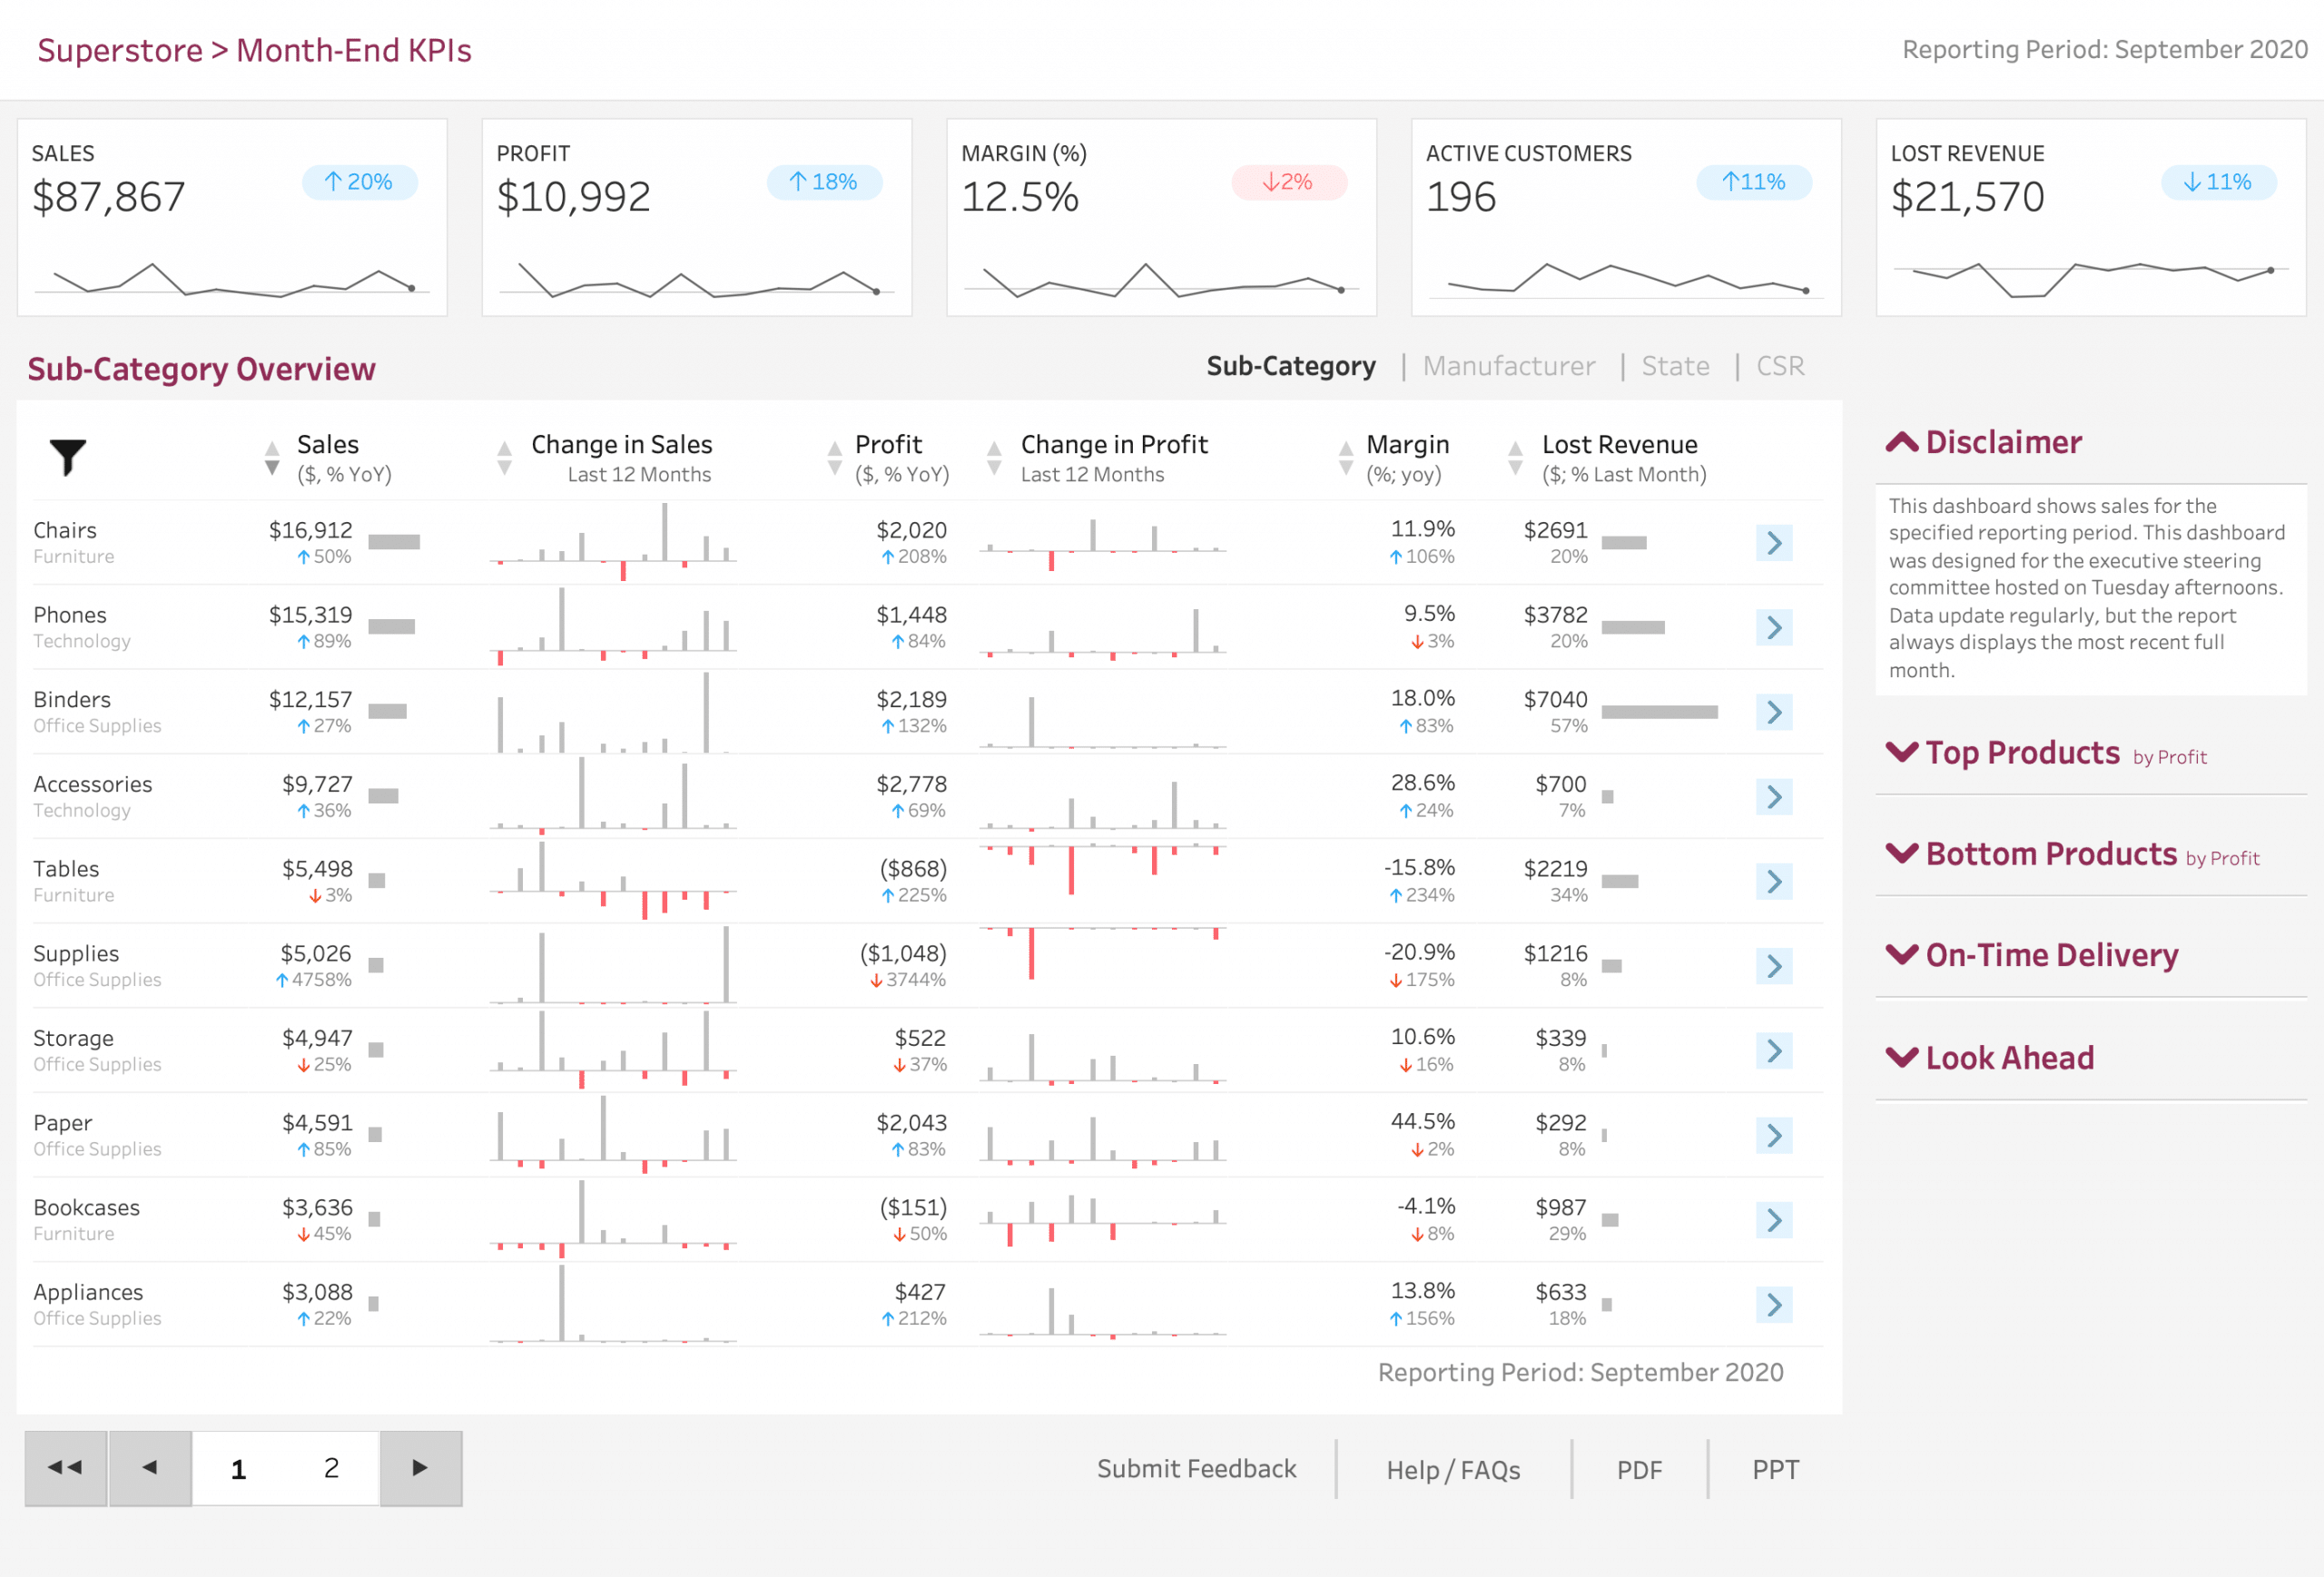

Table Pagination

Tables are nice, but a good table has pagination, which you can learn the technique here:

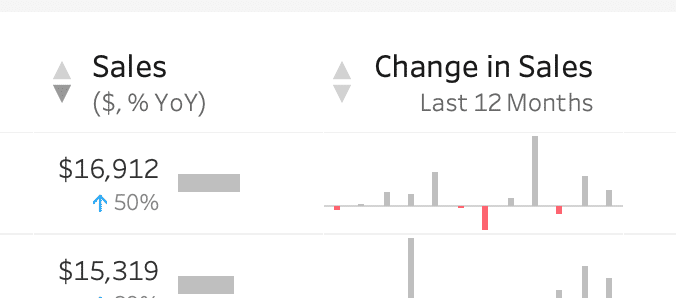
Table Sorting

Because we build a custom table, we added custom sorting which you can learn about here:

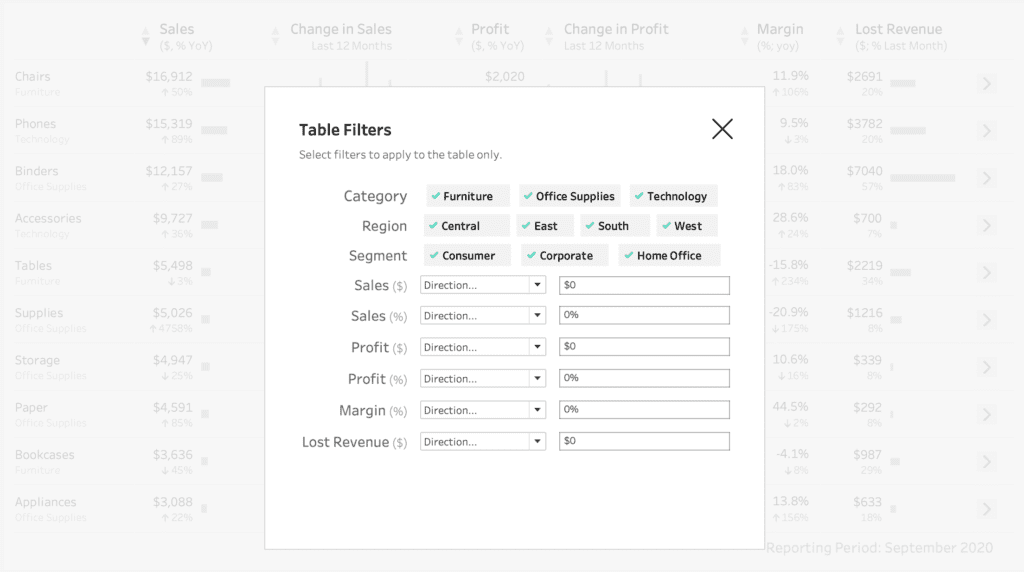
Table Filtering

Filtering takes work to get right so I’d recommend these blogs:

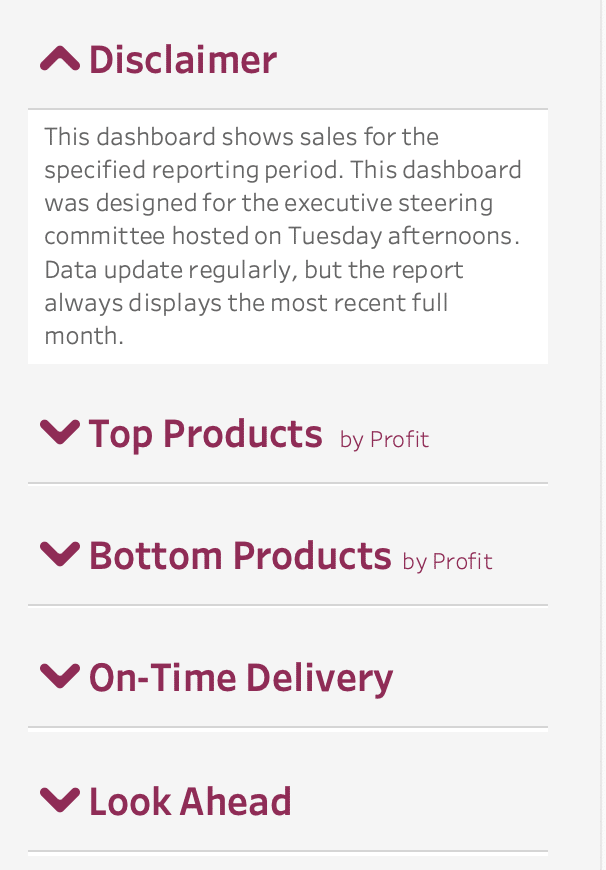
Accordion Menu

Want to use an accordion menu? Check out Workout Wednesday.

Detail Drill thru

This was a subtle lesson but you can find it as example #18 in the tables examples:

Highlight/Deselect Values

This was a subtle lesson but you can find it as example #18 in the tables examples:

Transparent Shapes

To create the FAQs overlay, you’ll want to use a transparent shape.

Deselect Everything

I dont like marks being selected so I use this technique to turn it “off”.

More to explore

Life Sciences Data Management Platform vs ERP
AI & ML

Why Traditional ERP Systems Fail to Track the Patient Journey in Life Sciences

Deepti Cole

·

July 20, 2026

Read article

Read article
Enterprise AI Strategy: The ROI Reckoning
Intelligence Platform

The AI Reckoning Is Coming

Vincent Yates

·

July 16, 2026

Read article

Read article
Data Engineering

KNIME Flow Variables: A Practical Guide

Bianca Sterpone

·

July 15, 2026

Read article

Read article